 Global| Jan 10 2005
OECD Leading Economic Index Weak
by:Tom Moeller
|in:Economy in Brief
Summary
The Leading Index of the Big 7 economies in the OECD continued to move sideways in November and was at roughly the same level as in March of last year. Six month growth in the index fell to 0.1%, its weakest since the spring of 2003. [...]
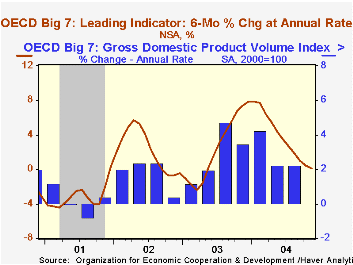
The Leading Index of the Big 7 economies in the OECD continued to move sideways in November and was at roughly the same level as in March of last year. Six month growth in the index fell to 0.1%, its weakest since the spring of 2003.
During the last ten years there has been a 69% correlation between the q/q change in the GDP Volume Index for the Big Seven countries in the OECD and the change in the leading index.
Growth in the leading index for the US economy again was negative, pulled own by a narrower interest rate yield curve and fewer construction starts.
The leaders for the Japanese economy did emerge from negative territory but at +0.1% indicated only modest improvement.
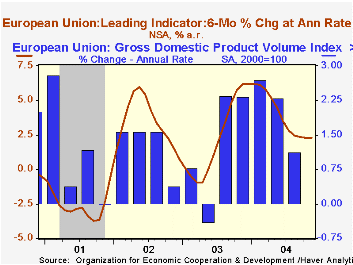
The leaders for the 15 countries in the European Union remained relatively firm, rising modestly for the fifth consecutive month and that pulled the six month growth rate to 2.3%. Weakness in the leaders for the German and French economies was offset by improvement in the leaders for Italy, Spain and the United Kingdom.
Visit the OECD.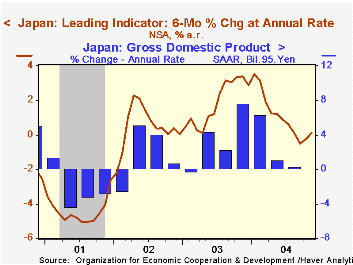
| OECD | Nov | Oct | Y/Y | 2003 | 2002 | 2001 |
|---|---|---|---|---|---|---|
| Composite Leading Index | 101.91 | 101.86 | 1.3% | 97.58 | 96.38 | 94.39 |
| 6 Month Growth Rate | 0.1% | 0.4% | 2.5% | 2.2% | -3.2% |
by Tom Moeller January 10, 2005
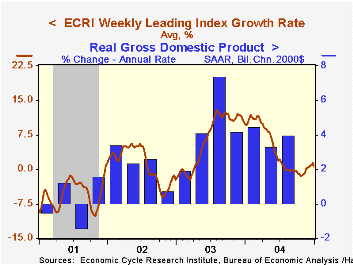
The weekly leading index of the US economy published by the Economic Cycle Research Institute (ECRI) fell a sharp 1.8% in the closing week of 2004.
The decline was due to higher claims for jobless insurance and higher bond yields and lowered the Indexes' smoothed six month growth rate to 0.7%, the lowest in nearly one month.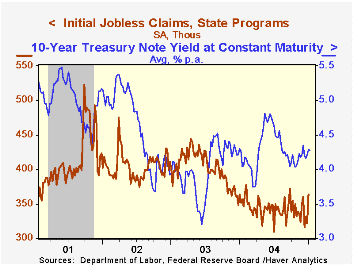
During the last ten years there has been a 54% correlation between the change in the weekly leading index and the quarterly change in US real GDP. There has been over the last ten years a 71% correlation between the y/y change in the ECRI leaders and the Index of Leading Economic Indicators from the Conference Board.
Visit the Economic Cycle Research Institute for analysis of US and international business cycles at .
| Economic Cycle Research Institute | 12/31/04 | 12/24/04 | Y/Y | 2004 | 2003 | 2002 |
|---|---|---|---|---|---|---|
| Weekly Leading Index | 131.4 | 133.8 | 0.9% | 132.5 | 124.8 | 119.9 |
| 6 Month Growth Rate | 0.7% | 1.4% | 4.3% | 6.5% | 1.1% |

Tom Moeller
AuthorMore in Author Profile »Prior to joining Haver Analytics in 2000, Mr. Moeller worked as the Economist at Chancellor Capital Management from 1985 to 1999. There, he developed comprehensive economic forecasts and interpreted economic data for equity and fixed income portfolio managers. Also at Chancellor, Mr. Moeller worked as an equity analyst and was responsible for researching and rating companies in the economically sensitive automobile and housing industries for investment in Chancellor’s equity portfolio. Prior to joining Chancellor, Mr. Moeller was an Economist at Citibank from 1979 to 1984. He also analyzed pricing behavior in the metals industry for the Council on Wage and Price Stability in Washington, D.C. In 1999, Mr. Moeller received the award for most accurate forecast from the Forecasters' Club of New York. From 1990 to 1992 he was President of the New York Association for Business Economists. Mr. Moeller earned an M.B.A. in Finance from Fordham University, where he graduated in 1987. He holds a Bachelor of Arts in Economics from George Washington University.
More Economy in Brief


