 Global| Oct 10 2005
OECD Leaders Signal Further Growth
by:Tom Moeller
|in:Economy in Brief
Summary
The Leading Index of the Major 7 OECD economies rose for the third consecutive month in August following four months of decline. The 0.1% gain followed increases of 0.5% during the prior two months and the leaders' six month growth [...]
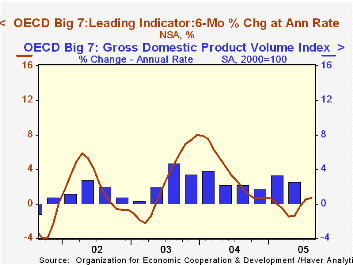
The Leading Index of the Major 7 OECD economies rose for the third consecutive month in August following four months of decline. The 0.1% gain followed increases of 0.5% during the prior two months and the leaders' six month growth rate rose to 0.7%, its best this year.
During the last ten years there has been a 68% correlation between the change in the leading index and the q/q change in the GDP Volume Index for the Big Seven countries in the OECD.
The leading index for Japan rose for the third consecutive month following five months of decline. The 0.4% increase improved the six month growth rate to 0.8%, the best since January and was paced by higher share prices, more loans and rising construction.
Leaders in the European Union (15 countries) also turned in the third consecutive monthly rise with a 0.5% gain that lifted six month growth to 1.5%, the best since last November.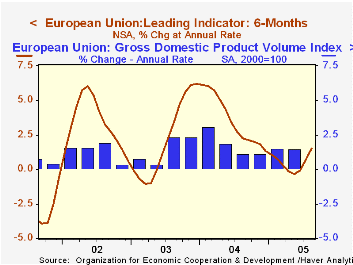
German leaders added 0.7% to an upwardly revised 1.2% July increase. Six month growth improved to 3.2% as a result of strong new orders, low inventories and an improving business climate. The French leaders rose for the second month and the 0.5% increase pulled the six month growth rate up to -0.8%. Earlier months' figures were revised down. The Italian leading index finally showed positive movement. A 0.6% increase was double the upwardly revised July increase, pulled the six month growth rate positive for the first time in over a year and reflected improved new orders and production, though consumer confidence still is dreary.
The U.S. leaders slipped 0.2%. The decline followed three successive months of increase and caused six month growth to back off to 1.1% as the yield curve tightened, consumer sentiment sagged and construction spending fell. The Canadian leaders dropped a sharp 1.6% following earlier months' declines that were revised from positive gains. The six month growth rate fell hard to a negative 5.0%, the worst since early 2001. A soft money supply, a tighter yield curve, lower housing starts and weak production explain the recent weakness.
The UK leaders rose modestly for the third consecutive month and six month growth turned positive (0.03%) for the first month since November due to higher share prices.
The latest OECD Leading Indicator report is available here.
Living Longer Must Mean Working Longer from the OECD can be found here.
| OECD | Aug | July | Y/Y | 2004 | 2003 | 2002 |
|---|---|---|---|---|---|---|
| Composite Leading Index | 102.31 | 102.23 | 0.2% | 102.03 | 97.59 | 96.30 |
| 6 Month Growth Rate | 0.7% | 0.5% | 3.5% | 2.6% | 2.2% |
by Louise Curley October 10, 2005
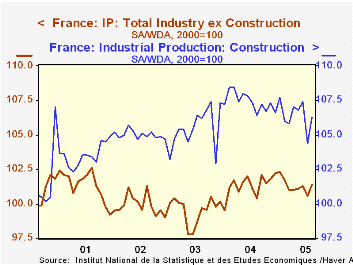
French industrial production, excluding construction, rose 0.8% in August after falling 0.7% in July. The rise brings the index to 101.4 (2000=100) its highest level since February of this year. Production of consumer goods, excluding autos, was up 0.98% in the month and 1.87% over August, 2004. Auto production fell 3.06% in August, but was even with production in August, 2004. Capital goods production rose 0.49% in August and was 1.87% above the year ago figure. The largest increase among the components of industrial production was a 1.92% increase in intermediate goods, suggesting that manufactures may be increasing inventories. While the rise in production is encouraging, it does not, so far, indicate any marked improvement in the relatively flat trend that has persisted since mid 2003.
Increased activity in French construction in the month of August was also reported today. The index rose 1.82% from July to 106.3 (2000=100). The level of construction was, however, slightly below that of a year ago. Construction activity, in contrast to production activity, has shown a slight downward trend since mid 2003. The rise in construction activity in August, like that in production, does not yet indicate a change in the trend. The industrial production and construction indexes are shown in the first chart.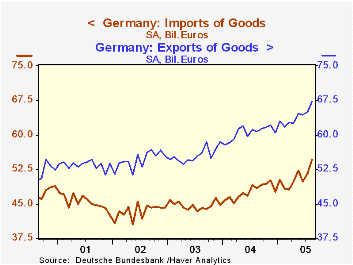
German exports of goods were 67.30 billion euros in August, a 3.52% increase from July and a 10.76% increase from August of a year ago. The 10% decline in the euro this year and good demand outside the euro area have been largely responsible for the good showing. Imports, however, increased 6.01% in August and were 12.77% over the corresponding month of a year ago, due in part to the increased price of oil. As a result, the balance on goods fell 0.81 billion euros from 13.46 billion euros in July to 12.65 billion euros in August but was 0.35 billion euros above August 2004. German exports and imports of goods are shown in the second chart.
| France | Aug 05 | Jul 05 | Aug 04 | M/M % | Y/Y % | 2004 | 2003 | 2002 |
|---|---|---|---|---|---|---|---|---|
| Industrial Production, ex construction (2000=100) | 101.4 | 100.6 | 100.4 | 0.80 | 1.00 | 101.3 | 99.6 | 99.9 |
| Consumer goods, ex autos | 103.5 | 102.5 | 101.6 | 0.98 | 1.87 | 101.6 | 99.5 | 99.3 |
| Autos | 107.7 | 111.1 | 107.7 | -3.06 | 0.00 | 112.8 | 107.6 | 108.9 |
| Capital goods | 103.3 | 102.8 | 101.4 | 0.49 | 1.87 | 101.4 | 99.1 | 99.0 |
| Intermediate goods | 95.6 | 93.8 | 95.4 | 1.92 | 0.21 | 96.1 | 94.8 | 96.7 |
| Construction (2000=100) | 106.3 | 104.4 | 106.4 | 1.82 | -0.09 | 107.4 | 105.5 | 105.0 |
| Germany | Aug 05 | Jul 05 | Aug 04 | M/M % | Y/Y % | 2004 Mo Avg |
2003 Mo Avg |
2002 Mo Avg |
| Exports SA (Bil euros) | 67.30 | 65.01 | 60.76 | 3.52 | 10.76 | 60.48 | 55.57 | 54.54 |
| Imports | 54.65 | 51.55 | 48.46 | 6.01 | 12.77 | 47.65 | 44.66 | 43.33 |
| Balance | 12.65 | 13.46 | 12.30 | -0.81* | 0.35* | 12.82 | 10.91 | 11.16 |

Tom Moeller
AuthorMore in Author Profile »Prior to joining Haver Analytics in 2000, Mr. Moeller worked as the Economist at Chancellor Capital Management from 1985 to 1999. There, he developed comprehensive economic forecasts and interpreted economic data for equity and fixed income portfolio managers. Also at Chancellor, Mr. Moeller worked as an equity analyst and was responsible for researching and rating companies in the economically sensitive automobile and housing industries for investment in Chancellor’s equity portfolio. Prior to joining Chancellor, Mr. Moeller was an Economist at Citibank from 1979 to 1984. He also analyzed pricing behavior in the metals industry for the Council on Wage and Price Stability in Washington, D.C. In 1999, Mr. Moeller received the award for most accurate forecast from the Forecasters' Club of New York. From 1990 to 1992 he was President of the New York Association for Business Economists. Mr. Moeller earned an M.B.A. in Finance from Fordham University, where he graduated in 1987. He holds a Bachelor of Arts in Economics from George Washington University.
More Economy in Brief


