 Global| Jul 11 2005
OECD Leaders Lower Still, North American Increase Limited
by:Tom Moeller
|in:Economy in Brief
Summary
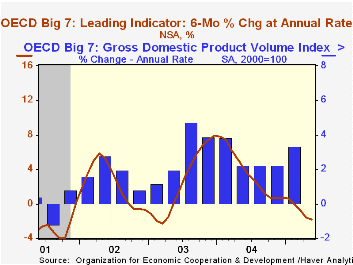
The Leading Index of the Major 7 OECD economies fell for the fourth straight month in May. The 0.2% decline pulled the index down 1.3% since December and lowered six month growth in the index to a negative 1.8%, the weakest since [...]

The Leading Index of the Major 7 OECD economies fell for the fourth straight month in May. The 0.2% decline pulled the index down 1.3% since December and lowered six month growth in the index to a negative 1.8%, the weakest since March 2003.
During the last ten years there has been a 69% correlation between the change in the leading index and the q/q change in the GDP Volume Index for the Big Seven countries in the OECD.
A 0.2% decline in May coupled with downward revisions to earlier months' data caused the leaders for the European Union (15 countries) to extend their decline to six consecutive months. Six month growth dropped to a negative 0.9%.
German leaders fell for the seventh month in the last eight. The 0.2% decline was caused by weaker new orders, a more sharply negative yield curve and a depressed business climate. Ssix month growth in the leading index fell to -2.1%, the worst in three and a half years. The French leaders also fell by 0.2% with six month growth a negative 1.3%. The yield curve was about dead flat and prospects for the industrial sector dimmed. The Italian leading index fell a hard 0.5% in May. This seventh consecutive decline lowered the six month growth rate to -2.8% and was caused by continued souring of consumer confidence as well as a weaker future tendency of orders books.
The UK economic leaders continued down and fell 0.4% for the second month. Six month growth fell to -1.9% due to even weaker consumer confidence and weaker prospects for production.The 1.0% decline in the leaders for Japan was double the drop in April, was the fifth decline this year and caused six month growth to fall to a negative 3.5%, the worst since late 2001.
The leading index for the US economy rose a modest 0.2%. The first increase since January improved six month growth slightly to -1.0% but the May increase was entirely due to higher durable goods (aircraft) orders. The Canadian leaders also moved higher by 0.4% and six month growth improved to a -0.3%. Share prices rose in May but other leading indicator components fell.
The latest OECD Leading Indicator report is available here.
| OECD | May | April | Y/Y | 2004 | 2003 | 2002 |
|---|---|---|---|---|---|---|
| Composite Leading Index | 100.97 | 101.17 | -1.0% | 101.98 | 97.52 | 96.33 |
| 6 Month Growth Rate | -1.8% | -1.6% | 3.5% | 2.5% | 2.3% |
by Louise Curley July 11, 2005

Data on the volume and value of Chinese imports of crude petroleum and petroleum products were released today by CEIC, a private organization based in Hong Kong that publishes a vast amount of data on China. In its new data base--CHINA--Haver lists some 125,000 data series that CEIC publishes.
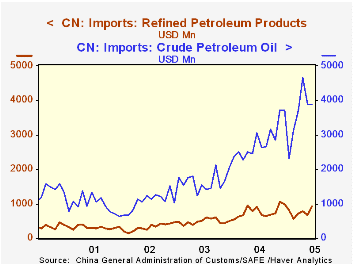
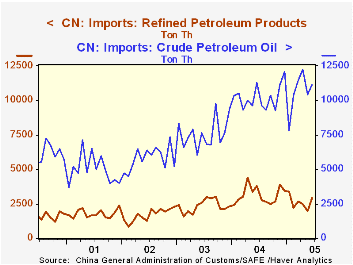
According to these data, the volume of Chinese imports of crude petroleum shows some signs of peaking, but with rising prices, the value is still on a sharp upward trend. The volume and value trends of petroleum products are more muted than those of crude petroleum . The first chart shows the value of imports of crude petroleum and petroleum products while the second chart shows the volume of imports of each.
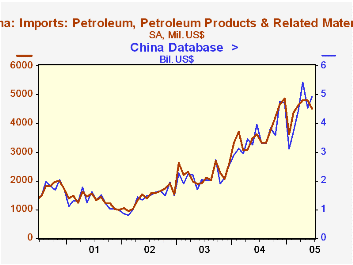
The CEIC data are available a week to ten days before the official data shown in EMERGEPR and while the CEIC data do not equal the official data exactly, they are a good approximation as can be seen in the third chart, which compares the value of imports of crude petroleum and petroleum products in the EMERGEPR data base with the sum of these two items in the CHINA data base.

| CEIC DATA | Jun 05 | May 05 | Jun 04 | M/M% | Y/Y% | 2004 | 2003 | 2002 |
|---|---|---|---|---|---|---|---|---|
| Value of Chinese Imports (Millions of US$) | ||||||||
| Crude Petroleum | 3884.6 | 3883.1 | 3062.7 | 0.04 | 26.84 | 33913 | 19824 | 12761 |
| Petroleum Products | 935.5 | 659.8 | 902.5 | 41.79 | 3.67 | 9241 | 5875 | 3802 |
| Volume of Chinese Imports (Thousands of Tonnes) | ||||||||
| Crude Petroleum | 11120 | 10410 | 11270 | 6.82 | -1.33 | 122830 | 91130 | 69240 |
| Petroleum Products | 2920 | 1970 | 3820 | 48.22 | -2356 | 37860 | 28230 | 20350 |
Tom Moeller
AuthorMore in Author Profile »Prior to joining Haver Analytics in 2000, Mr. Moeller worked as the Economist at Chancellor Capital Management from 1985 to 1999. There, he developed comprehensive economic forecasts and interpreted economic data for equity and fixed income portfolio managers. Also at Chancellor, Mr. Moeller worked as an equity analyst and was responsible for researching and rating companies in the economically sensitive automobile and housing industries for investment in Chancellor’s equity portfolio. Prior to joining Chancellor, Mr. Moeller was an Economist at Citibank from 1979 to 1984. He also analyzed pricing behavior in the metals industry for the Council on Wage and Price Stability in Washington, D.C. In 1999, Mr. Moeller received the award for most accurate forecast from the Forecasters' Club of New York. From 1990 to 1992 he was President of the New York Association for Business Economists. Mr. Moeller earned an M.B.A. in Finance from Fordham University, where he graduated in 1987. He holds a Bachelor of Arts in Economics from George Washington University.
More Economy in Brief
 Global| Feb 05 2026
Charts of the Week: Balanced Policy, Resilient Data and AI Narratives
by:Andrew Cates


