 Global| Mar 13 2006
OECD Leaders' Gains Slower but Suggest Economic Growth
by:Tom Moeller
|in:Economy in Brief
Summary
The Leading Index of the Major 7 OECD economies increased 0.2% in January. For December, the index increased 0.3% but that was revised down from a 0.6% gain reported initially. While the latest increases represent a slight slowdown [...]
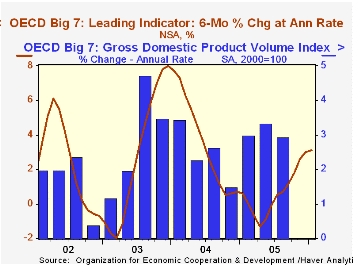
The Leading Index of the Major 7 OECD economies increased 0.2% in January. For December, the index increased 0.3% but that was revised down from a 0.6% gain reported initially. While the latest increases represent a slight slowdown from the 0.4% and 0.5% advances of October and November, the deceleration reflects weaker figures for the U.S., not elsewhere
During the last ten years there has been a 66% correlation between the change in the leading index and the q/q change in the GDP Volume Index for the Big Seven countries in the OECD.
The U.S. leaders fell 0.1% during January and rose by a moderate 0.3% the prior month, a gain initially reported at 0.9%. The leaders' six month growth slipped, as a result, to 3.2% from 3.7% during the prior month. The correlation between the leaders' growth rate and real GDP growth has been a high 73% during the last ten years.
In Japan, the leading index rose 0.5% in January though the strong 0.5% gain initially reported for December was revised lower to 0.3%. Nevertheless, the index's six month growth rate improved to 2.8%, it's best in two years. The leaders' correlation with real economic growth in Japan has been a meaningful 40% during the last ten years.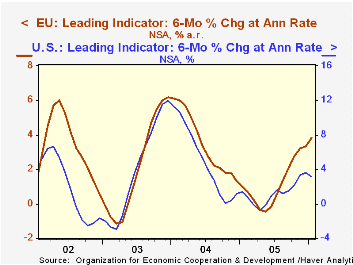
Leaders in the European Union (15 countries) rose 0.4% after a 0.2% December increase. The rise lifted the six month growth rate to 3.8%, the best since May '04. During the last ten years there has been a 59% correlation between the change in the leading index and the quarterly change in the GDP volume index for the European Union.
TheGerman leading index increased 0.7% for the ninth consecutive monthly increase and improved series' the six month growth rate to 7.0%, the best since February 2004. New orders have risen sharply and the business climate indicator has improved markedly.
A 0.2% increase in the January leading indicators for France represented an improvement from the 0.1% December gain (revised down from the initial estimate) and the 3.9% six month growth rate remained up from the negative growth rates of last Summer. Even the Italian leading index showed an improved no change from a 0.1% December decline and negative changes reported earlier were revised to slightly positive, all sufficient to lift the series' six month growth rate to 0.04% versus negative growth from early 2004 through all of last year.
The UK leaders also improved to plus 0.2% from slight decline during the prior two months and the six month growth rate rose to a slightly positive 0.2% from slightly negative growth during 2005.
The Canadian leaders surged 0.7% though the 0.8% jump during December was half the gain initially estimated. The six month growth nevertheless improved to 2.3%, its most promising since Summer 2004 The correlation of the leaders' growth with Canadian real GDP has been 49% during the last ten years.
The latest OECD Leading Indicator report is available here.
| OECD | Jan | Dec | Y/Y | 2005 | 2004 | 2003 |
|---|---|---|---|---|---|---|
| Composite Leading Index | 104.51 | 104.28 | 1.7% | 102.78 | 102.41 | 97.90 |
| 6 Month Growth Rate | 3.1% | 3.0% | 0.6% | 3.6% | 2.8% |
by Louise Curley March 13, 2006
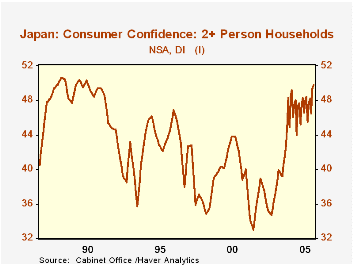
The diffusion index of Consumer confidence in Japan rose sharply in early 2004 and has shown little change up or down since then. However, the index in February, 2006 at 49.8 is the highest level since early 1990.
Monthly data on consumer confidence in Japan are available only from April, 2004 and are seasonally unadjusted. The data are published by the Cabinet Office which has engaged the market research firm, Shin Joho Center, Inc. to survey and analyze data from a sample of households that contains 5,040 two or more person households and 1,680 single person households. (Some problems with the data collection of the market research firm surfaced last August, but have subsequently been resolved to the satisfaction of the Cabinet Office.) To gain some historical perspective, the new monthly series is linked to the old quarterly Consumer Confidence Index, excluding the single person households. The result is shown in the attached chart where the quarterly data prior to April 2004, have been interpolated and linked with the new series. T
Since September of last year, more Japanese consumers have been expecting prices to rise than those expecting prices to fall. We have aggregated the data shown in the Haver Data Base--Japan: Price Expectations. In the data base percentages are shown for up 2% or less, up between 2 and 5% and up over 5%, no change, down less than 2%, down between 2 and 5% and down over 5% and "don't know". In the table below the total of percentages expecting rises, and the total of those expecting no change or a decline are shown with the percentage responding 'Don't know" for the months since June 2005...
| Japan | Feb 06 | Jan 06 | Feb 05 | M/M % | Y/Y % | 2005 | 2004 | 2003 |
|---|---|---|---|---|---|---|---|---|
| Consumer Confidence | 49.8 | 49.5 | 47.4 | 0.61 | 4.62 | 47.3 | 45.6 | 37.3 |
| Price Expectations | Feb 06 | Jan 06 | Dec 05 | Nov 05 | Oct 05 | Sep 05 | Aug 05 | Jul 05 |
| Percent Increase | 50.9 | 53.2 | 51.4 | 55.6 | 53.9 | 55.7 | 44.6 | 43.5 |
| Percent Decrease or Same | 43.7 | 40.8 | 40.0 | 39.4 | 40.4 | 36.1 | 49.8 | 50.1 |
| Don't Know | 5.6 | 6.0 | 8.7 | 5.0 | 5.6 | 8.1 | 5.7 | 6.4 |

Tom Moeller
AuthorMore in Author Profile »Prior to joining Haver Analytics in 2000, Mr. Moeller worked as the Economist at Chancellor Capital Management from 1985 to 1999. There, he developed comprehensive economic forecasts and interpreted economic data for equity and fixed income portfolio managers. Also at Chancellor, Mr. Moeller worked as an equity analyst and was responsible for researching and rating companies in the economically sensitive automobile and housing industries for investment in Chancellor’s equity portfolio. Prior to joining Chancellor, Mr. Moeller was an Economist at Citibank from 1979 to 1984. He also analyzed pricing behavior in the metals industry for the Council on Wage and Price Stability in Washington, D.C. In 1999, Mr. Moeller received the award for most accurate forecast from the Forecasters' Club of New York. From 1990 to 1992 he was President of the New York Association for Business Economists. Mr. Moeller earned an M.B.A. in Finance from Fordham University, where he graduated in 1987. He holds a Bachelor of Arts in Economics from George Washington University.
More Economy in Brief


