 Global| Apr 11 2005
OECD Leaders Decline Broadly
by:Tom Moeller
|in:Economy in Brief
Summary
The Leading Index of the Big 7 OECD economies slipped 0.3% in February following three consecutive months of gain. The decline reversed the earlier improvement in the index's six month growth rate and it fell to 0.3%, the weakest in [...]
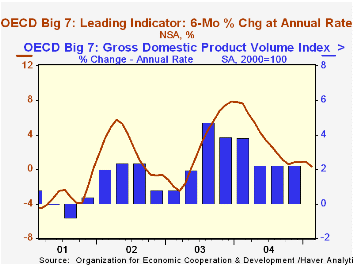
The Leading Index of the Big 7 OECD economies slipped 0.3% in February following three consecutive months of gain. The decline reversed the earlier improvement in the index's six month growth rate and it fell to 0.3%, the weakest in nearly two years.
During the last ten years there has been a 69% correlation between the change in the leading index and the q/q change in the GDP Volume Index for the Big Seven countries in the OECD.
The 0.1% February decline in the leaders for the European Union (15 countries) was the third in a row and pulled the six month growth rate to 0.5%, it's weakest in nearly two years. The German leaders fell 0.4% m/m and six month growth fell to a barely positive 0.2%. The French leaders slipped for the third consecutive month pulling six month growth to 0.1% and the fourth consecutive monthly decline in the Italian leaders lowered the six month growth rate to -0.9%.
The leading index for the US economy slipped 0.1% following three months of moderate gain leaving six month growth subdued at 1.4%.The leaders for Japan fell 0.8% and six month growth fell to -0.4%.
Growth in the leaders for the UK economy slipped for the fourth consecutive month pulling six month growth solidly negative at -1.6%.The Canadian leaders didn't decline for the first month since last July but six month growth remained a negative 2.7%.
The latest OECD Leading Indicator report can be found here.
| OECD | Feb | Jan | Y/Y | 2004 | 2003 | 2002 |
|---|---|---|---|---|---|---|
| Composite Leading Index | 102.22 | 102.48 | 0.3% | 101.99 | 97.51 | 96.33 |
| 6 Month Growth Rate | 0.3% | 0.9% | 3.6% | 2.5% | 2.3% |
by Louise Curley April 11, 2005
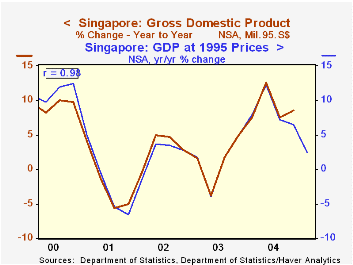
The advance estimate for the year to year growth in Singapore's first quarter seasonally unadjusted Gross Domestic Product was 2.4%, down from 6.5% in the fourth quarter of 2004 and was well below the average growth for all of 2004 at 7.5%. The manufacturing sector was up 3.0%, compared with an increase of 14.1% in the fourth quarter of 2004. Construction continued to decline but the first quarter decline of 6.5% was smaller that that of the 8.4% decline in the fourth quarter of 2004. The service sector showed a 3.5% increase compared with 4.8% in the previous quarter.
The advance estimates published by the Ministry of Trade and Industry, based largely on data from the first two months of the quarter, are intended as an early indicator of GDP growth and are subject to revision as more comprehensive data become available. The advance estimates are, however, a good indicator of the actual results as can be seen in the first chart that compares the advance estimates with the actual results.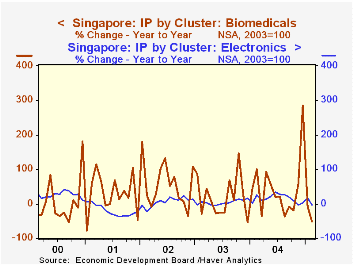
Although the first quarter GDP was 2.4% above the first quarter of 2004, the Ministry of Trade and Industry noted that on a seasonally adjusted annual rate basis, GDP in the first quarter declined by 5.8% from the fourth quarter of 2004, which had been 7.9% above the third quarter. Part of the wide swing from growth of 7.9% to a decline of 5.8% can be attributed to production in the Biomedical sector which includes the volatile pharmaceutical industry. The second chart compares the production indexes for the biomedical and electronics industries and shows that the volatility of the biomedical sector is far greater even than that of the electronics industry, which itself is noted for its wide swings.
| Singapore: Gross Domestic Product | Q1 05 | Q4 04 | Q3 04 | Q2 04 | Q1 04 | 2004 | 2003 | 2002 |
|---|---|---|---|---|---|---|---|---|
| Y/Y Advance Estimates % | ||||||||
| Total | 2.4 | 6.5 | 7.2 | 12.3 | 7.9 | 8.5 | 1.1 | 2.2 |
| Manufacturing | 3.0 | 14.1 | 11.2 | 20.1 | 10.2 | 13.9 | 3.0 | 8.0 |
| Construction | -6.5 | -8.4 | -11.4 | -6.4 | 1.0 | -6.3 | -10.7 | -10.8 |
| Services | 3.5 | 4.8 | 6.9 | 11.4 | 7.2 | 7.6 | 1.0 | 1.4 |
| Q/Q SA annual rate % | -5.8 | 7.9 | 0.7 | 7.5 | 10.1 | 8.5 | 1.1 | 2.2 |
| Manufacturing Production 2003=100 | Feb 05 | Jan 05 | Feb 04 | M/M | Y/Y | 2004 | 2003 | 2002 |
| Biomedical | 53.4 | 102.1 | 111.3 | -67.1 | -52.0 | 25.7 | 10.8 | 43.0 |
| Pharmaceutical | 42.3 | 173.7 | 116.1 | -75.6 | -63.6 | 29.8 | 13.4 | 48.6 |
| Electronics | 97.9 | 110.0 | 100.3 | -11.0 | -2.4 | 14.8 | 4.5 | 5.2 |
| Chemicals and Products | 101.4 | 114.6 | 100.3 | -11.5 | 1.1 | 7.9 | 6.5 | 11.1 |
| Precision Equipment | 86.6 | 102.6 | 99.8 | -15.6 | -13.2 | 7.8 | -0.7 | 2.0 |
| Transport Equipment | 128.6 | 130.4 | 101.3 | -1.4 | 27.0 | 24.0 | -6.0 | 8.9 |

Tom Moeller
AuthorMore in Author Profile »Prior to joining Haver Analytics in 2000, Mr. Moeller worked as the Economist at Chancellor Capital Management from 1985 to 1999. There, he developed comprehensive economic forecasts and interpreted economic data for equity and fixed income portfolio managers. Also at Chancellor, Mr. Moeller worked as an equity analyst and was responsible for researching and rating companies in the economically sensitive automobile and housing industries for investment in Chancellor’s equity portfolio. Prior to joining Chancellor, Mr. Moeller was an Economist at Citibank from 1979 to 1984. He also analyzed pricing behavior in the metals industry for the Council on Wage and Price Stability in Washington, D.C. In 1999, Mr. Moeller received the award for most accurate forecast from the Forecasters' Club of New York. From 1990 to 1992 he was President of the New York Association for Business Economists. Mr. Moeller earned an M.B.A. in Finance from Fordham University, where he graduated in 1987. He holds a Bachelor of Arts in Economics from George Washington University.
More Economy in Brief


