 Global| Jul 10 2009
OECD Indicators Begin To Turn Up
Summary
The OECD LEIs are giving off much more optimistic signals theses days. Ordinary progressive growth rates ( 12-mo to 6-mo to 3-mo) in the table’s top panel show that decelerations in the indicators have ceased across the OECD area for [...]
The OECD LEIs are giving off much more optimistic signals
theses days. Ordinary progressive growth rates ( 12-mo to 6-mo to 3-mo)
in the table’s top panel show that decelerations in the indicators have
ceased across the OECD area for these major groupings. Japan is still
declining over three-months, however, its pace of decline has been cut.
The US, the e-Area and the OECD area as whole show positive three-month
growth rates as of May.
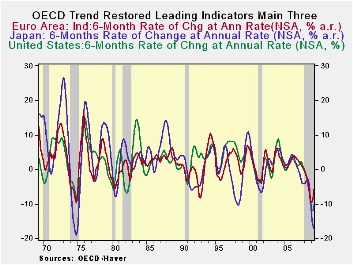
In the chart’s bottom panel we look at six month interval
growth rates since the OECD prefers this horizon for its trend-restored
leading indicators. On this basis decelerations in the indicators have
stopped across these main OECD grouping except in Japan. Only the
e-Area is showing an increase in its indicator over six months. The US
pace of decline in the OECD indictor has been cut sharply over the
recent six months, compared to six month ago. Given its embedded
patterns, the US indicator over six months should be showing advances
in one or two months as long as there is no backsliding.
On balance the OECD trend-restored leading indicts are giving
off positive signals. Every major region is showing some progress.
Japan which is still having the most difficult time is making progress
in its short term growth gauges not at the six-month horizon that the
OECD prefers. Still, it’s progress.
| Growth progression-SAAR | ||||
|---|---|---|---|---|
| 3Mos | 6Mos | 12mos | Yr-Ago | |
| OECD | 4.9% | -2.7% | -8.2% | -2.2% |
| OECD7 | 3.2% | -4.9% | -9.8% | -2.7% |
| OECD.E Area | 9.1% | 1.8% | -5.8% | -2.7% |
| OECD. Japan | -11.9% | -18.1% | -17.1% | -3.0% |
| OECD US | 4.0% | -5.4% | -10.3% | -2.4% |
| Six month readings at 6-Mo Intervals: | ||||
| Recent six | 6Mo Ago | 12Mo Ago | 18MO Ago | |
| OECD | -2.7% | -13.4% | -2.9% | -1.5% |
| OECD7 | -4.9% | -14.5% | -3.2% | -2.2% |
| OECD.Eur | 1.8% | -12.9% | -4.5% | -0.9% |
| OECD.Japan | -18.1% | -16.1% | -0.6% | -5.4% |
| OECD US | -5.4% | -15.0% | -3.0% | -1.7% |
| Slowdowns indicated by BOLD RED | ||||

Robert Brusca
AuthorMore in Author Profile »Robert A. Brusca is Chief Economist of Fact and Opinion Economics, a consulting firm he founded in Manhattan. He has been an economist on Wall Street for over 25 years. He has visited central banking and large institutional clients in over 30 countries in his career as an economist. Mr. Brusca was a Divisional Research Chief at the Federal Reserve Bank of NY (Chief of the International Financial markets Division), a Fed Watcher at Irving Trust and Chief Economist at Nikko Securities International. He is widely quoted and appears in various media. Mr. Brusca holds an MA and Ph.D. in economics from Michigan State University and a BA in Economics from the University of Michigan. His research pursues his strong interests in non aligned policy economics as well as international economics. FAO Economics’ research targets investors to assist them in making better investment decisions in stocks, bonds and in a variety of international assets. The company does not manage money and has no conflicts in giving economic advice.
More Economy in Brief


