 Global| Aug 03 2007
NTC Shows Euro MFG is Slowing… but oh so slowly
Summary
The NTC MFG survey shows that among EMU members in the table only Austria and Greece saw their MFG sectors improve month to month in July. Over three months you can add The Netherlands to that list. Over six months while EMU-wide MFG [...]
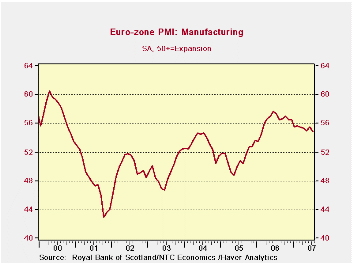
The NTC MFG survey shows that among EMU members in the table only Austria and Greece saw their MFG sectors improve month to month in July. Over three months you can add The Netherlands to that list. Over six months while EMU-wide MFG conditions eased in terms of the NTC index, only four EMU countries in the table saw their MFG sectors weaken (Germany, Italy, Spain and Austria). Over 12-months, however, all EMU members in this table except Greece are weaker. To be sure the slowdown in the EMU MFG sector is real and is widespread. It is also one that is in slow motion so that the overall MFG reading is still a relatively strong reading in the top 32 percent of its range (range since March of 2000). Previously the average EMU-wide drop in the NTC MFG index 13-months from its peak was 8%. In 2007 the drop 13-months after its peak is just 4.8%, the smallest by far. And although other cycles had peaked at a higher point (in 2000, for example) since 2000 this is still the highest index reading for Euro MFG 13 months after it had peaked. So the Euro-economy is proving itself to be very resilient even though the MFG slowing is quite widespread.
| Jul-07 | Jun-07 | 3-Mo | 6-Mo | 12-Mo | Percentile* | |
| Euro-13 | 54.90 | 55.56 | 55.16 | 55.31 | 55.89 | 68.2% |
| Germany | 56.75 | 57.33 | 56.71 | 56.88 | 57.71 | 78.0% |
| France | 53.34 | 53.75 | 53.80 | 53.75 | 54.50 | 49.6% |
| Italy | 53.34 | 53.98 | 54.11 | 54.05 | 54.44 | 60.2% |
| Spain | 53.22 | 55.05 | 53.86 | 54.87 | 55.50 | 69.6% |
| Austria | 53.81 | 53.54 | 53.80 | 54.61 | 56.07 | 67.5% |
| Greece | 53.95 | 53.48 | 53.84 | 53.76 | 53.04 | 54.3% |
| Ireland | 53.09 | 53.98 | 53.00 | 52.89 | 52.98 | 69.2% |
| Netherlands | 58.19 | 58.84 | 57.72 | 57.66 | 57.09 | 90.3% |
| EU | ||||||
| UK | 55.74 | 54.74 | 55.11 | 54.85 | 54.00 | 95.2% |
| *Percentile is over range since March 2000 | ||||||
by Tom Moeller August 1, 2007
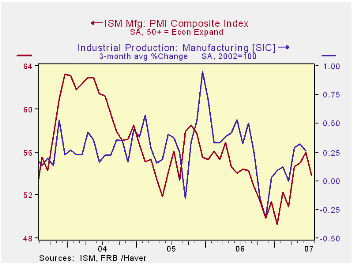
The Institute of Supply Management (ISM) reported that the Composite Index of activity in the manufacturing sector fell sharply to 53.8 from 56.0 during June. Consensus expectations for a lesser dip to 55.5 and the decline reversed the moderate gains of the prior two months.
During the last twenty years there has been a 64% correlation between the level of the Composite Index and the three month growth in factory sector industrial production.
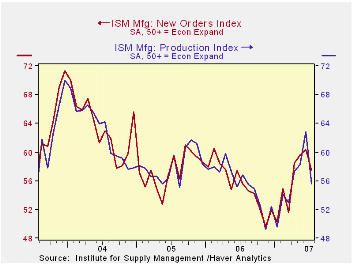
Three of the index's five components fell last month, but the decline in the production index was a notable 7.3 points to the lowest level since March. The employment index also fell for the third month in a row to the lowest level since March. During the last twenty years there has been a 67% correlation between the level of the ISM employment Index and the three month growth in factory sector employment.
The new orders index fell 2.8 points to the lowest since April. The inventory index rose 3.2 points to 48.5 and the supplier deliveries index rose in July to 52.0.
Prices fell three points to 65.0. This third consecutive monthly decline lowered the price index eight points below the recent peak in March. During the last twenty years there has been a 77% correlation between the price index and the three month change in the PPI for intermediate goods.
| ISM Manufacturing Survey | July | June | July '06 | 2006 | 2005 | 2004 |
|---|---|---|---|---|---|---|
| Composite Index | 53.8 | 56.0 | 54.4 | 53.9 | 55.5 | 60.5 |
| New Orders Index | 57.5 | 60.3 | 55.6 | 55.4 | 57.4 | 63.5 |
| Prices Paid Index (NSA) | 65.0 | 68.0 | 78.5 | 65.0 | 66.4 | 79.8 |
by Tom Moeller August 1, 2007
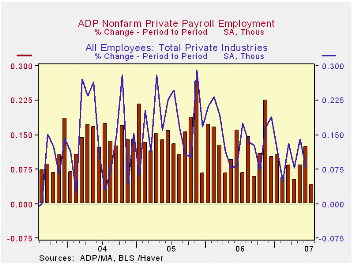 The ADP Nat'l Employment Report, reported by the payroll processor, indicated that private nonfarm payrolls rose just 48,000 last month. The increase was the smallest since 2003. The U.S. Bureau of Labor Statistics employment figure will be published this Friday.
Last month, ADP's measure of private nonfarm payrolls Juneindicated a 143,000 increase in jobs that was followed by a 92,000 increase in private nonfarm payrolls.
The full ADP National Employment Report can be found here, and the ADP methodology is explained here.
| LAXEPA@USECON | July | June | Y/Y | 2006 | 2005 | 2004 |
|---|---|---|---|---|---|---|
| Nonfarm Private Payroll Employment (m/m Chg.) | 48,000 | 143,000 | 1.2% | 1.7% | 1.8% | 1.3% |
by Tom Moeller August 1, 2007
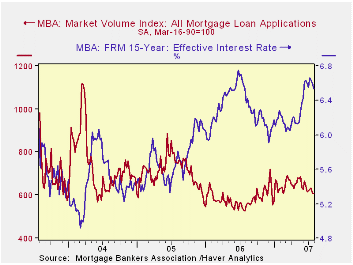
The total number of mortgage applications ticked down 0.3% last week following the 3.6% decline the week prior, according to the Mortgage Bankers Association.
Purchase applications dropped another 1.8% after the prior week’s 5.0% decline, the fifth decline in the last six weeks. The decline was to the lowest level since late April.
During the last ten years there has been a 58% correlation between the y/y change in purchase applications and the change in new plus existing single family home sales.
Applications to refinance recouped the prior week’s decline with a 1.8% increase.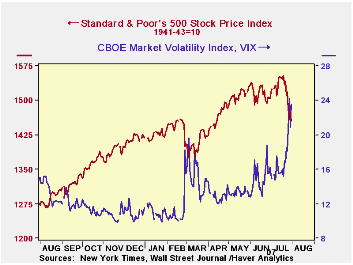
The effective interest rate on a conventional 30-year mortgage fell another six basis points w/w to 6.84%. Rates averaged roughly 6.91% last month, up from 6.28% in December. The peak for 30 year financing was 6.92% in mid-June. Rates for 15-year financing similarly fell to 6.53% last week. Interest rates on 15 and 30 year mortgages are closely correlated (>90%) with the rate on 10 year Treasury securities.
During the last ten years there has been a (negative) 79% correlation between the level of applications for purchase and the effective interest rate on a 30-year mortgage.
The Mortgage Bankers Association surveys between 20 and 35 top lenders in the U.S. housing industry. Then it derives its refinance, purchase and market indexes. The weekly survey covers roughly 50% of all U.S. residential mortgage applications processed each week by mortgage banks, commercial banks and thrifts. Visit the Mortgage Bankers Association site here.
Higher Risk Does Bring Higher Returns in Stock Markets Worldwide from the Federal Reserve Bank of St. Louis can be found here.
| MBA Mortgage Applications (3/16/90=100) | 7/27/07 | 7/20/07 | Y/Y | 2006 | 2005 | 2004 |
|---|---|---|---|---|---|---|
| Total Market Index | 607.1 | 609.0 | 15.1% | 584.2 | 708.6 | 735.1 |
| Purchase | 416.6 | 424.2 | 10.7% | 406.9 | 470.9 | 454.5 |
| Refinancing | 1,724.1 | 1,692.9 | 21.7% | 1,633.0 | 2,092.3 | 2,366.8 |
by Tom Moeller August 1, 2007
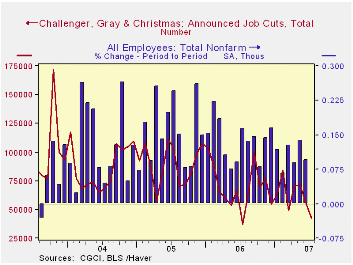
Challenger, Grey & Christmas reported that job cut announcements in July fell to the lowest level in a year, and that was the lowest level since 2000. The 23.1% m/m decline to 42,897 announcements followed a 21.6% decline during June.
Job cut announcements fell across most industries such as apparel (-32.0% y/y), chemical (-81.3% y/y), consumer goods (-43.9% y/y), industrial goods (-49.7% y/y), and services (-69.05 y/y. Increases in layoffs m/m occurred in the electronics, retail, and transportation industries.
During the last ten years there has been a 79% (inverse) correlation between the three month moving average of announced job cuts and the three month change payroll employment.
Job cut announcements differ from layoffs. Many are achieved through attrition, early retirement or just never occur.
Challenger also reported that announced hiring plans nearly doubled last month versus June and they were up sharply from a year ago.
| Challenger, Gray & Christmas | July | June | Y/Y | 2006 | 2005 | 2004 |
|---|---|---|---|---|---|---|
| Announced Job Cuts | 42,897 | 55,726 | 12.0% | 839,822 | 1,072,054 | 1,039,935 |
by Carol Stone August 1, 2007
Today, August 1st, as we write at mid-afternoon, the stock market is hovering near yesterday's close, following its up-and-down lurches of recent days, as investors have been factoring more risk into their portfolios. In this note, we highlight a couple of indicators of risk that are available in Haver databases and a piece of new economic data pertinent to the current troubles.
Yesterday's 1.3% decline in the S&P 500 index was the fifth daily fall in eight trading days since the July 19 all-time high close of 1,553.08 (and 14,000.41 in the Dow). It almost goes without saying that the day-to-day movements have been noticeably more volatile. One indication of this is that during June, the market drifted lower from the beginning of the month to the end. But it then reversed to set new highs just after mid-July and reversed again to show a decline of 3.2% for July as a whole and 6.3% from July 19 to month-end. Press reports have noted the greater volatility and called our attention to the "VIX" index, a measure based on the behavior of put-and-call options on the Standard & Poor's 500 stocks. VIX, the ticker symbol for "Volatility Index", is calculated from options prices on the Chicago Board Options Exchange, CBOE, and can be traded on its own without the complications of the actual options features. Daily changes in the VIX have an 87% negative correlation with daily movements in the S&P 500 index. This index, along with other indicators of options trading, is in Haver's DAILY database, and is seen in the first graph here. From an average just under 15 in June, the VIX reached 23.52 yesterday.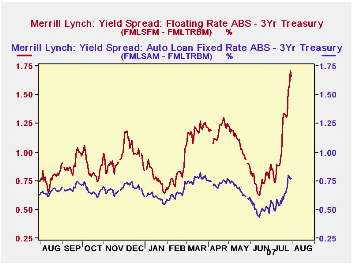
Also in DAILY, we carry a collection of Merrill Lynch fixed income yields. These are handy because they cover many sectors of the bond market and are calculated in standard ways, so they are all comparable with each other. Part of the markets' distress relates to the rise in short-term interest rates and the impact they have on instruments carrying adjustable rates. The Merrill yields include the class of asset-backed securities (ABS) that have floating rates, and we can compare that with a risk-free fixed Treasury rate of roughly the same maturity. The credit quality of the ABS "floaters" is not low; they differ from ordinary ABS's only in their floating- rate feature. But we can see in the second graph that their spread to Treasury's has widened sharply in just the last few weeks. While the spread of a fixed-rate ABS has also widened, the increment is much smaller.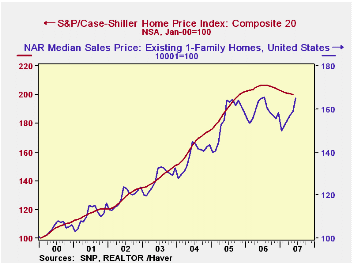
Finally, yesterday, S&P Case-Schiller reported its monthly house price index. This indicator of national home price movements edged down yet again in May, by 0.23% from April, a tenth consecutive monthly reduction. The Case-Schiller index has the advantage over other house price measures of using a collection of "repeat sales". The compilers canvass records of deeds, so their index is not a sample; it covers all house sale transactions in a particular area that meet certain specifications. The repeat-sales feature means the index is measuring price change in the same house, so it only reflects price change, not bigger vs. smaller houses, houses with pools vs. houses with no pool and so on. We can see in the last graph that despite an upturn in the median price of existing home sales compiled by the National Association of Realtors, the actual "price" of a given house has not yet started to improve. This is exactly the problem facing real estate markets generally at the present time: sellers can't get their price. This too adds risk to financial markets and we are seeing how widespread are the ramifications of this shortfall. The S&P Case-Schiller Index is in the USECON database and data for several cities appear in REGIONAL.
| July 31 | July 30 | July 27 | July 26 | July | June | Jan-May | |
|---|---|---|---|---|---|---|---|
| S&P 500* | 1455.27 | 1473.91 | 1458.95 | 1482.66 | 1520.70 | 1514.49 | 1450.14 |
| % Chg* | -1.3 | +1.0 | -1.6 | -2.3 | -3.2 | -1.8 | +1.5 |
| S&P VIX | 23.52 | 20.87 | 24.17 | 20.74 | 17.29 | 14.95 | 12.72 |
| Merrill Lynch Treasury: 3Yr | 4.546 | 4.555 | 4.522 | 4.522 | 4.823 | 4.992 | 4.675 |
| Merrill Lynch Asset-Backed Floater | 6.206 | 6.269 | 6.106 | 6.057 | 5.944 | 5.742 | 5.681 |
| Spread | 1.660 | 1.714 | 1.584 | 1.535 | 1.121 | 0.750 | 1.005 |
| May 2007 | Apr 2007 | Mar 2007 | May 2006 | 2006 | 2005 | 2004 | |
| S&P Case- Schiller Home Price Index** | 200.04 | 200.51 | 200.97 | 205.86 | 204.85 | 190.43 | 164.48 |
| -0.23 | -0.23 | -0.29 | -2.83 | +7.58 | +15.78 | +15.40 | |
| NAR Existing Home Median Price Index** | 159 | 159 | 155 | 164 | 159 | 156 | 138 |
| +1.2 | +1.4 | +1.8 | -2.9 | +2.0 | +12.8 | +8.1 |

Robert Brusca
AuthorMore in Author Profile »Robert A. Brusca is Chief Economist of Fact and Opinion Economics, a consulting firm he founded in Manhattan. He has been an economist on Wall Street for over 25 years. He has visited central banking and large institutional clients in over 30 countries in his career as an economist. Mr. Brusca was a Divisional Research Chief at the Federal Reserve Bank of NY (Chief of the International Financial markets Division), a Fed Watcher at Irving Trust and Chief Economist at Nikko Securities International. He is widely quoted and appears in various media. Mr. Brusca holds an MA and Ph.D. in economics from Michigan State University and a BA in Economics from the University of Michigan. His research pursues his strong interests in non aligned policy economics as well as international economics. FAO Economics’ research targets investors to assist them in making better investment decisions in stocks, bonds and in a variety of international assets. The company does not manage money and has no conflicts in giving economic advice.
More Economy in Brief


