Global| Jun 26 2007
Not a Shining Moment for U.S. Consumer Confidence
Summary
The present situation index is doing its leap frog advance thing and this month is one of its landing hops not an advancing hop. Expectations have moved to a weak flat-lining mode as they often do at mature stages of an expansion. If [...]
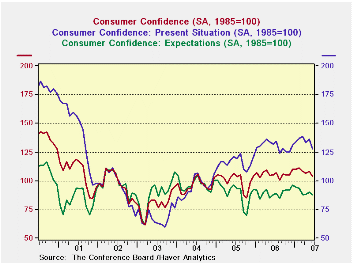
The present situation index is doing its leap frog advance thing and this month is one of its landing hops not an advancing hop. Expectations have moved to a weak flat-lining mode as they often do at mature stages of an expansion. If we did not have HIGH gas prices to blame we might be worried about this…
But what we do have is improving regional MFG surveys and evidence of still strong job growth. We do not have the accompanying signs that would make us really worried. My take on housing is that its declines are less severe; some regions are showing erratic advances and new home prices even rose 6% Yr/Yr. It hardly seems like all the news is bad. But then I’m not on anti-depressants and I don’t work at a firm that is up to its eyeballs in sub-prime paper. OK the high gas prices were a bummer. But the economic news is generally improving.
Still, many regions of the country are just having a real tough time – see table below.
The East North Central region is in bad shape AKA the rust belt. Old industry and auto sector troubles are raging in these states where current conditions, the strong reading of the trio, is some 20% lower than its level at end of the last recession. New England and the West North Central states are also laggards. But most regions are 20% above those lows with the Western Mountain States and the Pacific States considerably better off. Moreover, this month took all the regional readings down hard except New England.
While the regional reports look pretty glum, the responses arrayed by category do not. The confidence index is still in the top 15% of its post-recession range, as is the present situation. Expectations are weaker, in the 54th percentile of their range (see below).
As for survey components, business conditions in the present situation are in the top 20% of their range as is employment. For expectations, the percentiles are obviously lower: 48th percentile for business conditions expected, 49th percentile for employment conditions expected and 43rd percentile for income expected. Buying plans are low especially for houses, the bottom 10 percentile of their range. However, nearly everybody is planning to buy an appliance as that gauge stands in the 95th percentile of its range.
What we have is a weak month for confidence. The weakness still has not driven the levels of the index to a depressing state, it was just a large monthly decline. Now we look to the future to see if the weakness unwinds and how rapidly.
| Regional Confidence from Oct-03 to Jan-07 | % Above | % Below | ||||||
| Jun-07 | May-07 | Yr Ago | % Y/Y | Recsn-End | Pre-Recsn | Recsn-End | Pre-Recsn | |
| New England | 116.9 | 113.8 | 114.8 | 1.8% | 112.3 | 207.1 | 4.1% | -43.6% |
| MidAtlantic | 106.9 | 117.0 | 101.8 | 5.0% | 88.7 | 150.7 | 20.5% | -29.1% |
| East North Central | 73.9 | 86.3 | 81.0 | -8.8% | 92.8 | 175.6 | -20.4% | -57.9% |
| West North Central | 131.5 | 136.0 | 130.2 | 1.0% | 126.9 | 172.8 | 3.6% | -23.9% |
| South Atlantic | 129.5 | 144.3 | 134.5 | -3.7% | 106.1 | 178.9 | 22.1% | -27.6% |
| East South Central | 113.6 | 130.5 | 122.7 | -7.4% | 92.5 | 146.9 | 22.8% | -22.7% |
| West South Central | 138.0 | 167.4 | 146.4 | -5.7% | 113.2 | 177.2 | 21.9% | -22.1% |
| Mountain | 151.8 | 177.4 | 156.7 | -3.1% | 108.7 | 178.9 | 39.7% | -15.1% |
| Pacific | 145.9 | 167.4 | 149.9 | -2.7% | 87.9 | 169.7 | 66.0% | -14.0% |
| Pre-recession is 1998-2000 | ||||||||
| Percentage of Regions with confidence improving | ||||||||
| CurrCond improving | Jun-07 | May-07 | Apr-07 | Mar-07 | Nov-06 | Oct-06 | Sep-06 | Aug-06 |
| MO/MO or as noted | 11.1% | 66.7% | 11.1% | 55.6% | 88.9% | 22.2% | 55.6% | 33.3% |
| Current | Max/Oct'03 | Min/Oct'03 | Year Ago | Percentile | |
| Confidence Index | 103.9 | 111.2 | 61.4 | 105.4 | 85.3% |
| Present Situation | 127.9 | 138.5 | 59.7 | 132.2 | 86.5% |
| Expectations | 87.9 | 110.2 | 61.4 | 87.5 | 54.3% |
| Jun-07 | Percentile standing | ||||
| Diffusion | Overall | Good | Bad | Normal | |
| Present Situation | -- | 86.5% | -- | -- | -- |
| Business Conditions | 55.5 | 80.5% | 85.7% | 11.5% | 36.9% |
| Employment | 53.0 | 79.3% | 83.8% | 12.6% | 18.6% |
| Expectations | -- | 54.3% | -- | -- | -- |
| Business Conditions | 52.6 | 38.8% | 20.7% | 34.8% | 68.7% |
| Employment | 48.5 | 49.2% | 20.7% | 34.8% | 68.7% |
| Income | 55.0 | 43.8% | 42.0% | 23.0% | 71.6% |
| Buying plans | |||||
| Automobile | -- | 34.1% | -- | -- | -- |
| House | -- | 10.5% | -- | -- | -- |
| Major Appliance | -- | 96.9% | -- | -- | -- |
| Percentile of range since Oct 2003 to date. 100% is High; 0% is Low | |||||

Robert Brusca
AuthorMore in Author Profile »Robert A. Brusca is Chief Economist of Fact and Opinion Economics, a consulting firm he founded in Manhattan. He has been an economist on Wall Street for over 25 years. He has visited central banking and large institutional clients in over 30 countries in his career as an economist. Mr. Brusca was a Divisional Research Chief at the Federal Reserve Bank of NY (Chief of the International Financial markets Division), a Fed Watcher at Irving Trust and Chief Economist at Nikko Securities International. He is widely quoted and appears in various media. Mr. Brusca holds an MA and Ph.D. in economics from Michigan State University and a BA in Economics from the University of Michigan. His research pursues his strong interests in non aligned policy economics as well as international economics. FAO Economics’ research targets investors to assist them in making better investment decisions in stocks, bonds and in a variety of international assets. The company does not manage money and has no conflicts in giving economic advice.
More Economy in Brief