 Global| May 03 2007
Nonmanufacturing ISM Shows Some Life
Summary
The Nonmanufacturing ISM rose smartly to 56 from 52.4. Its employment gauge rose to 51.9 from 50.8. Prices continue to be under upward pressures. The details of the ISM report shows that the main measures of the survey are just below [...]
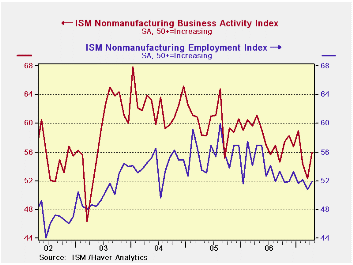 The Nonmanufacturing ISM rose smartly to 56 from 52.4. Its employment gauge rose to 51.9 from 50.8. Prices continue to be under upward pressures.
The details of the ISM report shows that the main measures of the survey are just below their period averages. The nonmanufacturing sector is dominated by services but also contains construction and mining. Apparently construction did pick up in the month. But despite the jump in activity, overall orders and backlogs were more restrained. Both showed growth or neutrality but each was below its customary reading (see relative calculations relative to the mean in the far right of the table). The readings that score lowest as a percentage of their range of values (percentiles) are supplier deliveries, inventory sentiment and import orders. Low supplier deliveries tell us there is still plenty of slack. The inventory reading tells us that inventories are more under control than they usually are and that could be a good sign for future ordering especially since growth in this sector has been strong. A weaker import reading could be a bad sign about activity or a sign that the weaker dollar has taken some toll on imports
During the period nonmanufacturing jobs averaged gains of 134K per month. The current ISM jobs barometer is just above the average for this period. Jobs: the outlook
Of course the ‘wild card’ in the nonmanufacturing jobs forecast is what happens with construction jobs. Construction spending in the month rose. And the ISM survey sees some increased construction activity. But those still might not be the right barometer for jobs. For consumer services, spending slowed in March, but again that may not be the right barometer for April, plus consumer service spending is strong apart from the unusual weak March result, having had a very brisk Q1 2007.
The service portion of the nonmanufacturing report has probably remained pretty firm. Construction is still a big question mark for any forecast. AND recent construction job growth has been volatile month to month. Still jobless claims have remained low and dipped further after the sample period for nonfarm employment passed. Claims do not act like a rash of construction job cuts have hit the street - or any others for that matter. That claims figure suggests that the job market is still probably pretty strong.
Overall the ISM nonmanufacturing index has been slowing despite the rebound this month. Still the ADP forecast seems far too weak at 64K overall. The ISM manufacturing survey showed a strong rise in the month for its jobs index. That should auger well for manufacturing job gains. April tends to be a strong month for job gains overall. The ISM nonmanufacturing reading was firm. We think a number like +120K or higher is sensible for private nonfarm jobs and government could boost things even beyond that. This month we part ways with the ADP Survey.
| ISM Nonmanufacturing Statistics from Jan. 1998 to Date | ||||||||||
|---|---|---|---|---|---|---|---|---|---|---|
| ISM-NMFG | Current | Last Mo | Std Dev | Average | SD%Avg | MAX | MIN | Range | Percentile | % of AVG |
| PM Activity | 56.0 | 52.4 | 4.7 | 57.5 | 8.2 | 67.9 | 40.5 | 27.4 | 56.6 | 97 |
| New Orders | 55.5 | 53.8 | 4.7 | 57.2 | 8.2 | 66.9 | 41.3 | 25.6 | 55.5 | 97 |
| Backlogs | 50.0 | 52.5 | 3.7 | 51.0 | 7.2 | 57.0 | 40.5 | 16.5 | 57.6 | 98 |
| Supplier Deliveries | 51.0 | 50.0 | 2.1 | 53.6 | 4.0 | 60.5 | 48.0 | 12.5 | 24.0 | 95 |
| Inventory Sentiment* | 60.5 | 63.0 | 2.7 | 63.0 | 4.3 | 69.0 | 55.0 | 14.0 | 39.3 | 96 |
| Inventories | 52.0 | 52.0 | 3.2 | 50.5 | 6.3 | 59.0 | 43.5 | 15.5 | 54.8 | 103 |
| Prices | 63.5 | 63.3 | 8.2 | 59.9 | 13.7 | 80.5 | 41.3 | 39.2 | 56.6 | 106 |
| Employment | 51.9 | 50.8 | 3.7 | 51.7 | 7.1 | 59.9 | 43.9 | 16.0 | 50.0 | 100 |
| Export Orders | 55.5 | 48.5 | 4.5 | 54.8 | 8.3 | 64.0 | 44.5 | 19.5 | 56.4 | 101 |
| Import Orders | 52.5 | 50.0 | 4.1 | 54.7 | 7.4 | 63.5 | 45.5 | 18.0 | 38.9 | 96 |

Robert Brusca
AuthorMore in Author Profile »Robert A. Brusca is Chief Economist of Fact and Opinion Economics, a consulting firm he founded in Manhattan. He has been an economist on Wall Street for over 25 years. He has visited central banking and large institutional clients in over 30 countries in his career as an economist. Mr. Brusca was a Divisional Research Chief at the Federal Reserve Bank of NY (Chief of the International Financial markets Division), a Fed Watcher at Irving Trust and Chief Economist at Nikko Securities International. He is widely quoted and appears in various media. Mr. Brusca holds an MA and Ph.D. in economics from Michigan State University and a BA in Economics from the University of Michigan. His research pursues his strong interests in non aligned policy economics as well as international economics. FAO Economics’ research targets investors to assist them in making better investment decisions in stocks, bonds and in a variety of international assets. The company does not manage money and has no conflicts in giving economic advice.
More Economy in Brief


