 Global| Nov 01 2002
Nonfarm Payrolls Fell Again
by:Tom Moeller
|in:Economy in Brief
Summary
Nonfarm payrolls fell about as expected last month, down 5,000. Figures for September and August were revised up slightly as a result of raised private service sector & construction figures. Amongst industries, factory sector jobs [...]
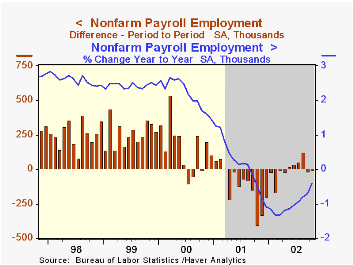
Nonfarm payrolls fell about as expected last month, down 5,000. Figures for September and August were revised up slightly as a result of raised private service sector & construction figures.
Amongst industries, factory sector jobs fell 49,000 (-2.7% YTD), continuing a decline that began in early 1998. The one-month diffusion index for the factory sector fell to 40.4, suggesting future declines in manufacturing sector jobs. Construction jobs fell 27,000 (-1.4% YTD). Jobs in service producing industries rose 70,000 (0.5% YTD). Government employment rose 24,000 (0.9% YTD).
The length of the workweek dipped back to the 3Q average. As a result, the index of aggregate hours worked (employment times hours worked) fell 0.4% and began 4Q slightly below the average for 3Q. That followed a 0.2% 3Q decline.
The one-month diffusion index for nonfarm payrolls fell slightly to 47.3 from an upwardly revised September level of 50.7. The three month diffusion index rose to 48.7.These levels suggest little or no employment growth near term.
The gain in average hourly earnings (2.3% YTD) was slightly less than expected and September's gain was revised down.
The unemployment rate rose less than expected. Employment fell 271,000 (0.6% YTD) and the labor force fell 154,000 (0.6% YTD).
The nonfarm payroll employment figures are based on reports provided to the US Labor Department by businesses, while the figures from which the unemployment rate is derived are based on a survey of US households.
| Employment | Oct | Sept | Y/Y | 2001 | 2000 | 1999 |
|---|---|---|---|---|---|---|
| Payroll Employment | -5,000 | -13,000 | -0.4% | 0.2% | 2.2% | 2.4% |
| Manufacturing | -49,000 | -39,000 | -4.0% | -4.2% | -0.4% | -1.3% |
| Average Weekly Hours | 34.1 | 34.2 | 34.0 | 34.2 | 34.4 | 34.5 |
| Average Hourly Earnings | 0.2% | 0.2% | 3.0% | 4.1% | 3.9% | 3.6% |
| Unemployment Rate | 5.7% | 5.6% | 5.4% | 4.8% | 4.0% | 4.2% |
by Tom Moeller November 1, 2002
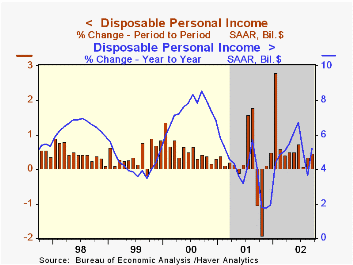
Personal income (4.5% AR, YTD) rose slightly less than expected last month. August's figure was revised down slightly. Consensus expectations were for a 0.5% gain.
Wage and salary disbursements rose 0.6% (3.3% AR, YTD) following the strong 0.5% August gain. Strength centered in the service industries where wages rose 0.9% (4.4% YTD, AR). Manufacturing wages were unchanged m/m and down 1.2% YTD (AR). Personal transfer payments rose 0.6% (10.2% YTD, AR). Personal interest income fell for the third straight month (1.0% YTD, AR).
Personal consumption expenditures fell more than expected. Durable goods purchases fell 5.1%, reflecting a 12.6% decline in light vehicle unit sales. Spending on nondurable goods also fell, down 0.1% (4.4% YTD, AR). Spending on services rose 0.4% (5.6% YTD, AR).
Disposable personal income rose 0.5% (8.9% AR, YTD). Personal tax payments were unchanged m/m but were down 19.2% YTD (AR).
The PCE price deflator rose 0.2% following a 0.2% rise in August. Prices were up 2.3% YTD (AR). Less food and energy, the price deflator rose 0.2% (1.9% YTD, AR).
| Disposition of Personal Income | Sept | Aug | Y/Y | 2001 | 2000 | 1999 |
|---|---|---|---|---|---|---|
| Personal Income | 0.4% | 0.3% | 3.7% | 3.3% | 8.0% | 4.9% |
| Personal Consumption | -0.4% | 0.4% | 6.0% | 4.5% | 7.0% | 6.7% |
| Savings Rate | 4.2% | 3.4% | 4.6% | 2.3% | 2.8% | 2.7% |
| PCE Price Deflator | 0.2% | 0.2% | 2.2% | 2.0% | 2.5% | 1.6% |
by Tom Moeller November 1, 2002
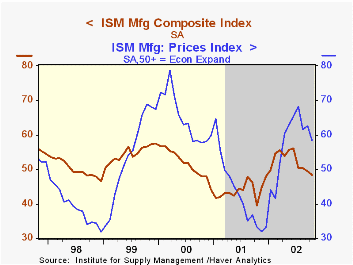
The ISM Composite Index of manufacturing sector activity remained below 50 for the second month. The decline to 48.5 was about as expected and consistent with yesterday's report from the Chicago purchasing managers. Before that report, Consensus expectations were for a decline in the ISM to 49.0.
Production, inventories and the supplier delivery indexes fell while new orders and employment rose just slightly.
Inflation pressure fell to the lowest level since March. The percentage (NSA) of companies reporting higher prices fell for the third straight month.
Over the last ten years there has been a 45% correlation between the ISM Composite Index and quarterly growth in real GDP.
| ISM Manufacturing Survey | Oct | Sept | Y/Y | 2001 | 2000 | 1999 |
|---|---|---|---|---|---|---|
| Composite Index | 48.5 | 49.5 | 39.5 | 43.9 | 51.6 | 54.6 |
| Prices Paid Index | 58.3 | 62.5 | 33.3 | 43.0 | 64.8 | 54.2 |
by Tom Moeller November 1, 2002
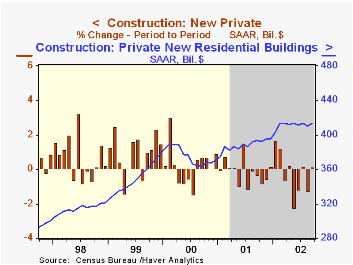
The value of construction put in place rose more than expected in September due to a surge in public sector spending. Figures for August were revised down but were revised up for July.
Residential building rose but the level of activity has been flat since February. Single family has been relatively strong but building on multi-unit structures has been down.
Nonresidential building activity fell hard for the seventh month this year and was down 15.3% YTD. The decline was again paced by lower industrial and office building.
Spending by governments rose sharply due to broad based increases amongst categories, notably a 10.3% gain in military facilities.
| Construction Put-in-place | Sept | Aug | Y/Y | 2001 | 2000 | 1999 |
|---|---|---|---|---|---|---|
| Total | 0.6% | -0.8% | 0.1% | 2.5% | 7.3% | 8.7% |
| Residential | 0.7% | -0.8% | 5.1% | 3.3% | 7.4% | 11.2% |
| Nonresidential | -1.7% | -2.9% | -18.8% | -3.1% | 7.1% | 1.9% |
| Public | 2.2% | 0.7% | 11.0% | 7.4% | 5.4% | 10.6% |

Tom Moeller
AuthorMore in Author Profile »Prior to joining Haver Analytics in 2000, Mr. Moeller worked as the Economist at Chancellor Capital Management from 1985 to 1999. There, he developed comprehensive economic forecasts and interpreted economic data for equity and fixed income portfolio managers. Also at Chancellor, Mr. Moeller worked as an equity analyst and was responsible for researching and rating companies in the economically sensitive automobile and housing industries for investment in Chancellor’s equity portfolio. Prior to joining Chancellor, Mr. Moeller was an Economist at Citibank from 1979 to 1984. He also analyzed pricing behavior in the metals industry for the Council on Wage and Price Stability in Washington, D.C. In 1999, Mr. Moeller received the award for most accurate forecast from the Forecasters' Club of New York. From 1990 to 1992 he was President of the New York Association for Business Economists. Mr. Moeller earned an M.B.A. in Finance from Fordham University, where he graduated in 1987. He holds a Bachelor of Arts in Economics from George Washington University.
More Economy in Brief


