 Global| Apr 04 2003
Nonfarm Payrolls Down Again
by:Tom Moeller
|in:Economy in Brief
Summary
Nonfarm payrolls fell in March by 108,000, the fifth decline in the last seven months. Consensus had expected a 25,000 worker decline. The drop in February payrolls was deepened to a loss of 357,000 from a loss of 308,000 reported [...]
Nonfarm payrolls fell in March by 108,000, the fifth decline in the last seven months. Consensus had expected a 25,000 worker decline. The drop in February payrolls was deepened to a loss of 357,000 from a loss of 308,000 reported last month.
March payrolls may have been again depressed by the activation of civilian workers for military duty.
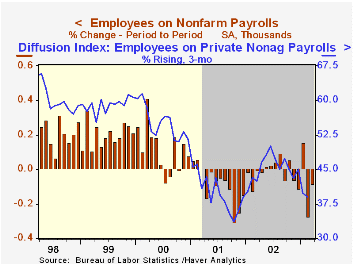
Diffusion indexes for nonfarm payrolls improved slightly but, remaining below 50, continued to suggest poor hiring prospects. The one-month index rose to 47.1 from a downwardly revised 39.2 in February. The three month diffusion index fell to 38.9. By measuring the breadth of gains, these indexes are leading indicators of job growth.
The unemployment rate was unchanged at 5.8%. Expectations had been for a rise to 5.9%. Employment fell 60,000 (+0.9% y/y), the fifth decline in six months. The labor force fell 64,000 (+1.0% y/y). The nonfarm payroll employment figures are based on reports provided to the US Labor Department by businesses, while the figures from which the unemployment rate is derived are based on a survey of US households.
Amongst industries the number of factory sector jobs fell 36,000 (-0.2% m/m, -2.8% y/y). The one-month diffusion index for the factory sector rose to 38.6 from a downwardly revised 36.8 in February. Construction jobs rose 21,000 (-0.8% y/y). Jobs in service producing industries fell 94,000 versus a downwardly revised 256,000 loss in February. Most of the downward revision to February was in retail and services. In March, retail hiring fell another 43,000 (-0.9% y/y). Services fell 10,000 and government employment fell 40,000.
The index of aggregate hours worked (employment times hours worked) rose 0.3%. The average of this index in 1Q was 0.1% below 4Q02.
Over the last ten years there has been a 57% correlation between the quarterly change in aggregate hours worked and real GDP. That correlation is down from 89% in the 1980s. The decline is due to the recent acceleration in productivity growth.
Average hourly earnings rose just 0.1%, slightly less than expected, and the strong gain in February was revised down slightly.
| Employment | Mar | Feb | Y/Y | 2002 | 2001 | 2000 |
|---|---|---|---|---|---|---|
| Payroll Employment | -108,000 | -357,000 | -0.2% | -0.9% | 0.2% | 2.2% |
| Manufacturing | -36,000 | -59,000 | -2.8% | -5.5% | -4.2% | -0.4% |
| Average Weekly Hours | 34.3 | 34.1 | 34.2 | 34.2 | 34.2 | 34.4 |
| Average Hourly Earnings | 0.1% | 0.6% | 3.1% | 3.2% | 4.0% | 3.8% |
| Unemployment Rate | 5.8% | 5.8% | 5.7% | 5.8% | 4.8% | 4.0% |

Tom Moeller
AuthorMore in Author Profile »Prior to joining Haver Analytics in 2000, Mr. Moeller worked as the Economist at Chancellor Capital Management from 1985 to 1999. There, he developed comprehensive economic forecasts and interpreted economic data for equity and fixed income portfolio managers. Also at Chancellor, Mr. Moeller worked as an equity analyst and was responsible for researching and rating companies in the economically sensitive automobile and housing industries for investment in Chancellor’s equity portfolio. Prior to joining Chancellor, Mr. Moeller was an Economist at Citibank from 1979 to 1984. He also analyzed pricing behavior in the metals industry for the Council on Wage and Price Stability in Washington, D.C. In 1999, Mr. Moeller received the award for most accurate forecast from the Forecasters' Club of New York. From 1990 to 1992 he was President of the New York Association for Business Economists. Mr. Moeller earned an M.B.A. in Finance from Fordham University, where he graduated in 1987. He holds a Bachelor of Arts in Economics from George Washington University.


