Global| Jun 12 2007
NFIB - Small Bounce but Still in Downtrend
Summary
The NFIB index is depicted in the chart as being in the grip of a downtrend with a minor uptrend that remains trapped in a bear channel. It is still not close to breaking out of that channel on the upside but it is headed in that [...]
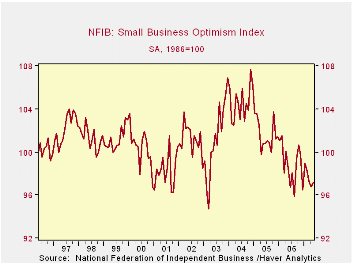
The NFIB index is depicted in the chart as being in the grip of a downtrend with a minor uptrend that remains trapped in a bear channel. It is still not close to breaking out of that channel on the upside but it is headed in that direction. At this point it is all speculation as to whether it will make it or not.
The responses to the broader NFIB survey are in the table below. They are for the most part still on the weak side as you would expect with an overall index that looks as this one does. Still, evidence on the overall US economy shows that conditions are getting better. So this improved performance could filter down and lift small business as well. But it could also be that weakness in small business is ‘the termites in the woodwork’ that will bring the big business strength down. Since much of hiring is in small businesses, the recent strength in jobs is encouraging even if not well reflected in the survey. For the moment it is a tug of war. These NFIB signals of course draw from this period of elevated energy prices and all firms are feeling that pinch. The revival of jobs growth after a period of persisting bad weather through the first four months of the year (as evidenced by work disruptions reported in the monthly jobs report) have now been set aside. In some sense we begin the process of assessing growth anew now with energy prices having moved up and the Fed no longer on a preconceived policy path and without a clear policy bias despite its stated relatively greater fear of inflation rising.
The NFIB survey shows rebounds in trends from March onward. Still the absolute readings are poor and are very low by historic standards; the response for "the economy is expected to improve" is in the bottom 11 percentile of its range since 2001. The one clear element lacking is that farms are unwilling to increase inventories. Capital spending plans are a touch weaker than they have been but still reside at a strong point relative to history (in the 90-plus percentile). Firms report fairly steady and moderate selling prices obtained and worker compensation costs paid. While firms are not planning to increase inventories, they report that inventories are rising. They report that credit has become relatively harder to get. Those reporting higher sales Q/Q are fewer in number but the number of positive responses is still historically at or above average depending on the period.
| NFIB | % of range | |||||
| May-07 | Apr-07 | Mar-07 | May-06 | since 2001* | since 1990* | |
| INDEX | 97.2 | 96.8 | 97.3 | 98.2 | 19.2% | 35.6% |
| % saying…… | ||||||
| Firms Expecting | ||||||
| Credit conditions to ease | -6.0 | -7.0 | -8.0 | -8.0 | 42.9% | 53.8% |
| Economy to Improve | -3.0 | -8.0 | -7.0 | -2.0 | 11.5% | 28.0% |
| Higher Real Sales 6-Mo | 16.0 | 14.0 | 14.0 | 17.0 | 47.6% | 47.6% |
| Firms Reporting | ||||||
| Higher Earnings | -15.0 | -19.0 | -15.0 | -19.0 | 60.7% | 60.7% |
| Inventories 'too low' | -6.0 | -3.0 | -5.0 | -2.0 | 10.0% | 9.1% |
| Good Time to Expand | 12.0 | 12.0 | 12.0 | 18.0 | 22.7% | 26.1% |
| Firms Planning | ||||||
| To Increase Employment | 13.0 | 13.0 | 12.0 | 13.0 | 63.2% | 57.1% |
| To Add Inventories | 0.0 | 3.0 | 3.0 | 3.0 | 7.7% | 20.0% |
| Capital expenditures 3-6 mos | 29.0 | 29.0 | 33.0 | 30.0 | 30.8% | 25.0% |
| Inflation Issues | ||||||
| Firms Raising | ||||||
| Avg Selling Price | 26.0 | 18.0 | 15.0 | 13.0 | 91.7% | 91.7% |
| Worker Compensation | 29.0 | 26.0 | 28.0 | 30.0 | 93.3% | 77.3% |
| Firms Plan to Raise | ||||||
| Avg Selling Price | 23.0 | 24.0 | 22.0 | 23.0 | 54.5% | 54.5% |
| Worker Compensation | 38.0 | 37.0 | 35.0 | 39.0 | 52.9% | 52.9% |
| Other | ||||||
| Firms Reporting | ||||||
| Higher sales Q/Q | 1.0 | 4.0 | 0.0 | -1.0 | 60.6% | 50.0% |
| Credit Harder to Get | 6.0 | 5.0 | 7.0 | 5.0 | 75.0% | 46.2% |
| Raising Inventories | 2.0 | -2.0 | 2.0 | 5.0 | 70.6% | 40.9% |
| *100% is high, 0% is low | ||||||

Robert Brusca
AuthorMore in Author Profile »Robert A. Brusca is Chief Economist of Fact and Opinion Economics, a consulting firm he founded in Manhattan. He has been an economist on Wall Street for over 25 years. He has visited central banking and large institutional clients in over 30 countries in his career as an economist. Mr. Brusca was a Divisional Research Chief at the Federal Reserve Bank of NY (Chief of the International Financial markets Division), a Fed Watcher at Irving Trust and Chief Economist at Nikko Securities International. He is widely quoted and appears in various media. Mr. Brusca holds an MA and Ph.D. in economics from Michigan State University and a BA in Economics from the University of Michigan. His research pursues his strong interests in non aligned policy economics as well as international economics. FAO Economics’ research targets investors to assist them in making better investment decisions in stocks, bonds and in a variety of international assets. The company does not manage money and has no conflicts in giving economic advice.
More Economy in Brief