 Global| Jun 26 2006
New Home Sales Continued Firm
by:Tom Moeller
|in:Economy in Brief
Summary
May new single family home sales continued unexpectedly firm and rose 4.6% m/m to 1.234 million (SAAR). The rise was third consecutive monthly increase and followed a 5.9% April gain that was little revised. Consensus expectations had [...]
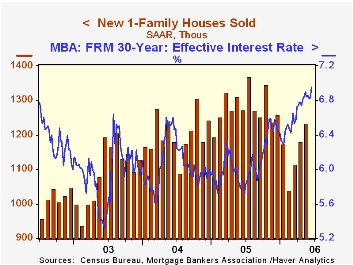
May new single family home sales continued unexpectedly firm and rose 4.6% m/m to 1.234 million (SAAR). The rise was third consecutive monthly increase and followed a 5.9% April gain that was little revised. Consensus expectations had been for a slight decline in sales to 1.15M during May.
Despite these signs of strength, new home sales so far this year are down 10.3% from the 2005 average and May sales were 9.7% below the monthly peak last July.
Sales down South posted the third consecutive firm m/m increase with a 6.0% gain (8.4% y/y). Year to year, that's the only region of country where sales were up. During May, sales in the Northeast fell 7.9% (-36.3% y/y), sales in the Midwest rose 2.7% but were off 20.8% y/y while in the West sales rose 5.3% in May but were down 12.7% y/y. 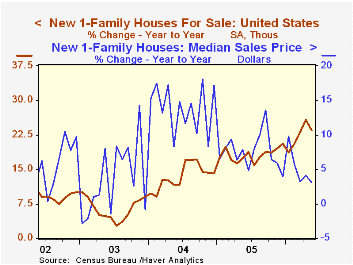
The number of new homes for sale dipped 0.7% m/m in May but were up a sharp 23.6% y/y. The year to year breakdown by region is as follows: Northeast, 52.8%; West, 27.2%; South, 31.0%; Midwest, -2.8%.
The median sales price of a new single family home fell 4.3% m/m to $235,300 following a 3.9% rise during April that was very much upwardly revised.
Movin' On Up from the Federal Reserve Bank of St. Louis is available here.
Can Financial Innovation Help to Explain the Reduced Volatility of Economic Activity? from the Federal Reserve Board can be found here.
| U.S. New Homes | May | April | Y/Y | 2005 | 2004 | 2003 |
|---|---|---|---|---|---|---|
| Total Sales (AR, 000's) | 1,234 | 1,180 | -5.9% | 1,280 | 1,201 | 1,091 |
| Median Price (NSA) | $235,300 | $245,900 | 3.1% | $234,208 | $217,817 | $191,383 |
by Louise Curley June 26, 2006
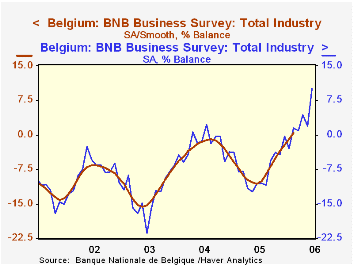
European measures of confidence for June are beginning to appear. Last Friday Belgium reported a surprisingly large increase in business confidence. The National Bank of Belgium's overall gross synthetic indicator of business confidence rose 8.1 point from May to June and reached 10.2%, the highest value on record since the series began in January, 1980. The Bank also calculates a smoothed series, excluding outliers, that reflects the underlying trend of confidence. The smoothed series is only available after a delay of three to four months. Both the current indicator and the smoothed series are shown in the first chart. The continued rise in the current indicator suggests that the underlying trend in consumer confidence is still positive.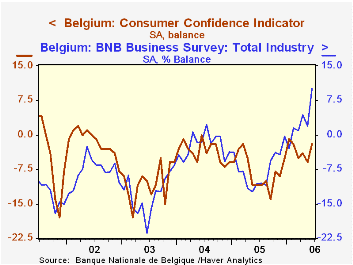
Consumers in Belgium are less confident than the business community. While they have shown a small increase in confidence recently, it has been more a case of a decline in the excess of pessimists over optimists.In June, the consumer indicator of confidence was -2% compared with -6% in May and -11% in June, 2005. Chart 2 compares the Belgian consumer and business confidence indicators.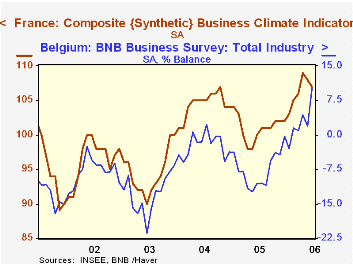
In contrast to Belgium, business confidence in France has been slipping since April when a recent peak of 109 was reached. Confidence measured 107 in June, down almost 1% from 108 in May, but up 7% since June, 2005. Chart 3 compares the measures of business confidence in France and Belgium. While the levels of confidence are not comparable, the trends in the two series can be compared. Until recently business confidence in France has tended to follow the same ups and downs as business confidence in Belgium. Since April, the trends have diverged. (The Belgian series is expressed as a percent balance between optimists and pessimists while the French series has been constructed so that it has an average of 100 and a standard deviation of 10.)
| Measures of Confidence | Jun 06 | May 06 | Jun 05 | M/M | Y/Y | 2005 | 2004 | 2003 |
|---|---|---|---|---|---|---|---|---|
| Belgium | ||||||||
| Business Confidence (%) | 10.1 | 2.0 | -10.7 | 8.1 | 20.8 | -7.5. | -2.3 | -12.9 |
| Consumer Confidence(%) | -2 | -6 | -11 | 4 | 9 | -8 | 4 | -11 |
| France | ||||||||
| Business Confidence (Average=100) | 107 | 108 | 100 | -0.93 | 7.00 | 101 | 104 | 95 |

Tom Moeller
AuthorMore in Author Profile »Prior to joining Haver Analytics in 2000, Mr. Moeller worked as the Economist at Chancellor Capital Management from 1985 to 1999. There, he developed comprehensive economic forecasts and interpreted economic data for equity and fixed income portfolio managers. Also at Chancellor, Mr. Moeller worked as an equity analyst and was responsible for researching and rating companies in the economically sensitive automobile and housing industries for investment in Chancellor’s equity portfolio. Prior to joining Chancellor, Mr. Moeller was an Economist at Citibank from 1979 to 1984. He also analyzed pricing behavior in the metals industry for the Council on Wage and Price Stability in Washington, D.C. In 1999, Mr. Moeller received the award for most accurate forecast from the Forecasters' Club of New York. From 1990 to 1992 he was President of the New York Association for Business Economists. Mr. Moeller earned an M.B.A. in Finance from Fordham University, where he graduated in 1987. He holds a Bachelor of Arts in Economics from George Washington University.
More Economy in Brief


