 Global| Oct 24 2016
NABE Survey Indicates Weaker Demand & Lower Profits
by:Tom Moeller
|in:Economy in Brief
Summary
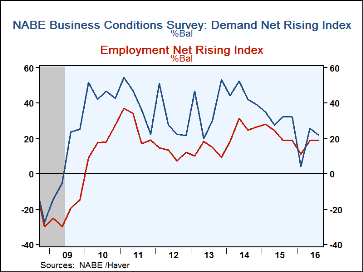
The Business Conditions Survey, published by the National Association for Business Economics, showed an easing in U.S. unit demand last quarter. The diffusion index reading (rising minus falling) fell to 22.0 from 25.5. While these [...]
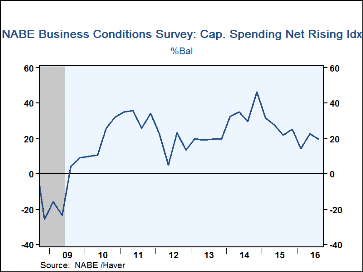
The Business Conditions Survey, published by the National Association for Business Economics, showed an easing in U.S. unit demand last quarter. The diffusion index reading (rising minus falling) fell to 22.0 from 25.5. While these figures show improvement from Q1'16, unit demand has been slowing since early 2014. Forty-three percent of respondents reported rising demand versus the 2013 high of 62.5%. This slowdown was accompanied by slightly weaker employment growth. The jobs index was little changed in Q3 at 18.6, and lower than the Q2'14 high of 31.3. A fairly steady 33.3% of firms raised job levels, but an increased 14.7% lowered them. Capital spending plans weakened. The index level of 19.4 was down q/q, and lower than the Q4'14 peak of 46.3. A sharply lower 31.2% of firms raised spending versus 51.2% at the Q4'14 peak.
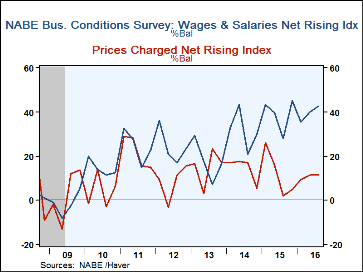
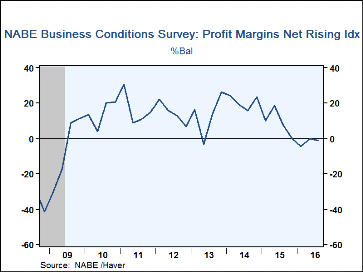
Pricing power remained constrained by the slowdown in final demand. The prices paid index stabilized q/q at 11.5, but was below the 2011 reading of 29.0. A fairly stable 20.8% of firms raised prices, but an increased 9.4% lowered them. At the same time, a tighter labor market led to firmer earnings for workers. The net rising index for wages & salaries rose to 42.6, up sharply from 7.1 in Q3'13. Forty-five percent of firms raised compensation, triple the percentage three years ago. The combination of moderate pricing power and increased labor costs depressed earnings. The profits index declined slightly last quarter and has trended sideways for a year. These readings are sharply below the strength registered in Q4'13 when a net 26.2% of respondents earned more.
The NABE figures can be found in Haver's SURVEYS database.
| NABE Business Conditions Survey (%) | Q3'16 | Q2'16 | Q1'16 | Q3'15 | 2015 | 2014 | 2013 |
|---|---|---|---|---|---|---|---|
| Conditions Over the Last Three Months; Net Rising Index | |||||||
| Unit Demand | 22.0 | 25.5 | 4.3 | 32.3 | 31.8 | 44.5 | 37.4 |
| Employment | 18.6 | 18.7 | 11.1 | 18.8 | 22.6 | 25.1 | 13.3 |
| Capital Spending | 19.4 | 22.6 | 14.3 | 22.1 | 26.7 | 35.9 | 19.6 |
| Prices Charged | 11.5 | 11.5 | 9.4 | 2.1 | 12.3 | 14.3 | 15.1 |
| Profit Margins | -1.1 | 0.0 | -4.6 | 7.5 | 9.0 | 20.6 | 13.2 |
| Wages & Salaries | 42.6 | 39.8 | 35.3 | 27.8 | 39.0 | 31.5 | 17.6 |
Tom Moeller
AuthorMore in Author Profile »Prior to joining Haver Analytics in 2000, Mr. Moeller worked as the Economist at Chancellor Capital Management from 1985 to 1999. There, he developed comprehensive economic forecasts and interpreted economic data for equity and fixed income portfolio managers. Also at Chancellor, Mr. Moeller worked as an equity analyst and was responsible for researching and rating companies in the economically sensitive automobile and housing industries for investment in Chancellor’s equity portfolio. Prior to joining Chancellor, Mr. Moeller was an Economist at Citibank from 1979 to 1984. He also analyzed pricing behavior in the metals industry for the Council on Wage and Price Stability in Washington, D.C. In 1999, Mr. Moeller received the award for most accurate forecast from the Forecasters' Club of New York. From 1990 to 1992 he was President of the New York Association for Business Economists. Mr. Moeller earned an M.B.A. in Finance from Fordham University, where he graduated in 1987. He holds a Bachelor of Arts in Economics from George Washington University.
More Economy in Brief
 Global| Feb 05 2026
Charts of the Week: Balanced Policy, Resilient Data and AI Narratives
by:Andrew Cates


