 Global| Jul 25 2007
Mortgage Applications Lowest Since February
by:Tom Moeller
|in:Economy in Brief
Summary
The total number of mortgage applications fell 3.6% last week to the lowest level since last February, according to the Mortgage Bankers Association. The decline was to a level 11.8% below the recent peak in March. Purchase [...]
The total number of mortgage applications fell 3.6% last week to the lowest level since last February, according to the Mortgage Bankers Association. The decline was to a level 11.8% below the recent peak in March.
Purchase applications fell a hard 5.0%, the fourth decline in the last five weeks. The decline was to the lowest level since late April.During the last ten years there has been a 58% correlation between the y/y change in purchase applications and the change in new plus existing single family home sales. 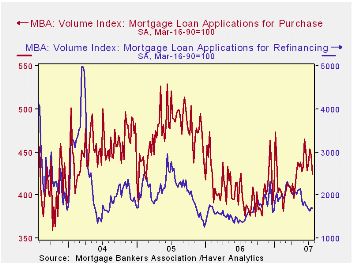
Applications to refinance also fell but by a moderate 1.4% after the prior week’s 4.9% advance.
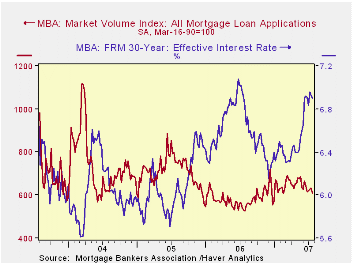
The effective interest rate on a conventional 30-year mortgage fell slightly to 6.90% from 6.93% the prior week. Rates averaged 6.84% last month, up from 6.28% in December. The peak for 30 year financing was 7.08% late in June. Rates for 15-year financing similarly fell to 6.60% last week. Interest rates on 15 and 30 year mortgages are closely correlated (>90%) with the rate on 10 year Treasury securities.
During the last ten years there has been a (negative) 79% correlation between the level of applications for purchase and the effective interest rate on a 30-year mortgage.
The Mortgage Bankers Association surveys between 20 and 35 top lenders in the U.S. housing industry. Then it derives its refinance, purchase and market indexes. The weekly survey covers roughly 50% of all U.S. residential mortgage applications processed each week by mortgage banks, commercial banks and thrifts. Visit the Mortgage Bankers Association site here.
The Narrowing of the Male-Female Wage Gap from the Federal Reserve Bank of San Francisco can be found here.
| MBA Mortgage Applications (3/16/90=100) | 7/20/07 | 7/13/07 | Y/Y | 2006 | 2005 | 2004 |
|---|---|---|---|---|---|---|
| Total Market Index | 609.0 | 631.6 | 14.1% | 584.2 | 708.6 | 735.1 |
| Purchase | 424.2 | 446.5 | 9.0% | 406.9 | 470.9 | 454.5 |
| Refinancing | 1,692.9 | 1,717.4 | 22.2% | 1,633.0 | 2,092.3 | 2,366.8 |
by Tom Moeller July 25, 2007
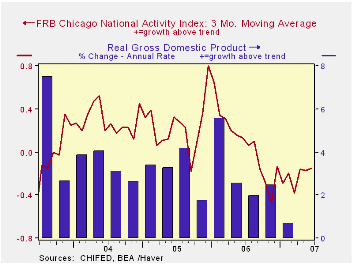
The National Activity Index (CFNAI) from the Federal Reserve Bank of Chicago improved in June to 0.11 from negative values which had been sustained during four of the prior five months.
The categories of production, income, sales and orders made positive contributions while the employment, consumption and housing categories were negative.
The three-month moving average of the CFNAI also improved but only slightly to a still negative value of -0.15, up from its worst level of -0.47 last November.
A zero value of the CFNAI indicates that the economy is expanding at its historical trend rate of growth and during the last twenty years there has been a 68% correlation between the level of the CFNAI and q/q growth in real GDP.
All of the CFNAI components contributed to the January decline includingproduction, employment, consumption and housing.
The CFNAI is a weighted average of 85 indicators of economic activity. The indicators reflect activity in the following categories: production and income, the labor market, personal consumption and housing, manufacturing and trade sales, and inventories & orders.
The complete CFNAI report is available here.
| Chicago Fed | June | May | June '06 | 2006 | 2005 | 2004 |
|---|---|---|---|---|---|---|
| CFNAI | 0.11 | -0.32 | 0.32 | 0.04 | 0.25 | 0.31 |
by Tom Moeller July 25, 2007
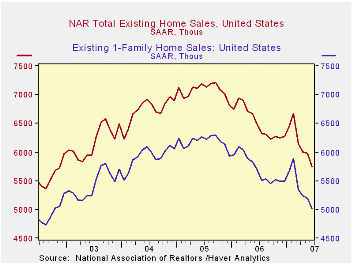
Sales of existing homes fell again in June. The 3.8% to 5.750M units to the lowest level since November 2002. Sales were down 20.2% from the peak during September of 2005.
Sales of single family homes fell a sharper 3.5% last month after a 1.0% decline in May. Sales were 20.5% lower than during the peak month of September 2005.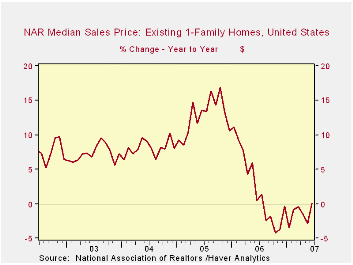
By region, single family home sales fell 5.3% (-10.0% y/y) in the Northeast. Out West sales dropped 6.5% (-19.4% y/y) in June. Sales in the Midwest dropped 3.2% (-8.3% y/y) and down South sales fell 1.4% (-11.1% y/y).
The inventory of single family "homes on the market" dropped 2.7%. The decline was the only the first this year and inventories were up 12.7% from last year.
The median price of an existing single family home rose 3.8% but versus last year, the price of $230,300 was up just 0.1%.
The broad aggregate data on existing home sales are included in Haver's USECON database; details about prices by region and inventories are available in the REALTOR database.Comparing the prime and subprime mortgage markets from the Federal Reserve Bank of Chicago is available here.
| Existing Home Sales (SAAR, 000s) | June | May | Y/Y | 2006 | 2005 | 2004 |
|---|---|---|---|---|---|---|
| Total Sales | 5,750 | 5,980 | -11.4% | 6,510 | 7,065 | 6,727 |
| Single-Family Sales | 5,010 | 5,190 | -12.1% | 5,708 | 6,182 | 5,914 |
| Median Single-Family Home Price (NSA,000s) | $230.3 | $221.9 | 0.1% | $221.9 | $217.5 | $192.8 |
by Robert Brusca July 25, 2007
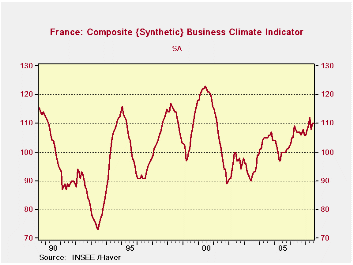
The INSEE Biz index for French industry is still in its impressive uptrend. Yet it is only in the 74th percentile of its range and it is about 10% above its mean value. The index is off peak and while the trend is technically still in place it is appropriate to wonder if the uptrend is abating.
Orders and demand trends are still firm but so is the series ‘likely price trend’. The MFG portion of the survey shows a bit more of a loss in momentum. The Production trend reading fell off in July to 17 from 24 but still ranking in the mid-70s in terms of the percentile of its range of values - a firm result. The recent trend for production assessment ticked up in July; the likely trend assessment also rose to 15 from 14. MFG prices expected are only at a reading of 6 and reside in their 62nd percentile of their range, a more modest showing than for French industry overall.
On balance, the readings from France are still solid and encouraging. Some of the inflation responses are, however, on the high side, and for overall industry, with a bit of momentum.
| Since Jan 1990 | Since Jan 1990 | |||||||||
| Jul-07 | Jun-07 | May-07 | Apr-07 | Percentile | Rank | Max | Min | Range | Mean | |
| Climate | 110 | 110 | 108 | 112 | 74.0 | 41 | 123 | 73 | 50 | 101 |
| Production | ||||||||||
| Recent Trend | 16 | 24 | 14 | 10 | 72.5 | 44 | 44 | -58 | 102 | -6 |
| Likely trend | 31 | 27 | 22 | 21 | 66.7 | 20 | 63 | -33 | 96 | 7 |
| Orders/Demand | ||||||||||
| Orders&Demand | 2 | 4 | 3 | 5 | 73.6 | 33 | 25 | -62 | 87 | -15 |
| Foreign Orders & Demand | 5 | 4 | 6 | 10 | 70.8 | 46 | 31 | -58 | 89 | -11 |
| Prices | ||||||||||
| Likely Sales Prices Trend | 10 | 10 | 9 | 4 | 70.2 | 26 | 24 | -23 | 47 | 0 |
by Carol Stone July 25, 2007
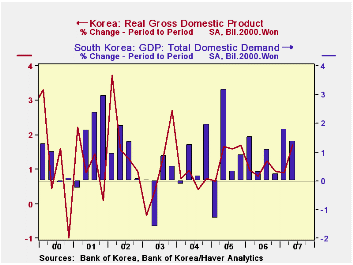
South Korea's GDP grew 1.7% in Q2, following 0.9% in the previous two quarters. This was the strongest quarterly increase since Q4 2003, 4-1/2 years ago. The year-to-year growth was 4.9%, up from 4.0% in Q1 and also in Q4.
The quarterly growth was led by the manufacturing sector, which rebounded sharply to a 3.6% quarterly increase from a 0.9% fall in Q1. This pushed the year-on-year rate to 5.9% from 3.9%. Data on industrial production suggest that Q2 started off stronger for electrical machinery, electronic components and motor vehicles. Service industries collectively slowed a bit in Q2, gaining 1.1% after 1.2% in Q1 and Q4. Construction activity declined outright, falling 1.8% after a 1.4% increase in Q1 and 0.6% in Q4. 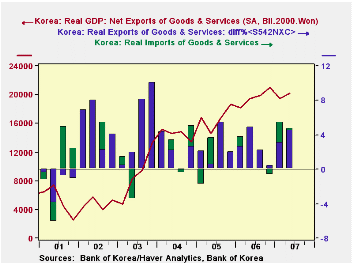
The expenditure accounts show that the greater part of the pickup in GDP came from foreign demand. Exports surged 4.6% in Q2, their strongest quarterly advance in a year. Imports rose 4.7%, but this was less than Q1's 5.4%, and net exports widened to a surplus of KRW20.23 trillion from KRW19.48 trillion in Q1. Domestic demand, in contrast, slowed to 1.4% growth in Q2 from 1.8% in Q1. So net foreign demand added 0.3% to total GDP growth after cutting it by 0.9% in Q1. 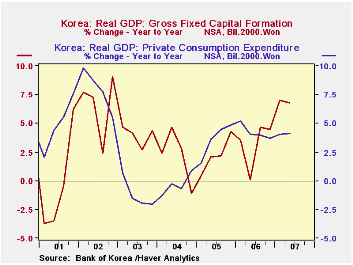
These figures hardly mean, however, that domestic demand was "weak". Private consumption was up 0.8% in the quarter and 4.1% from a year ago. Fixed investment also grew 0.8%, putting it a substantial 6.8% higher than the year-ago period. Within this latter category, what the Koreans call "facilities investment" led the way in Q2, with a gain of 3.5% following 4.4% the quarter before; encompassing machinery and transport equipment, this item was up 12.1% from a year ago, the strongest since radically higher growth during the tech boom of 1999/2000.
As these data might suggest, the Korean economy is showing steady, moderate growth, which it has sustained now since about 2002. In the 2000/2001 fall-out from the tech bust, it managed to avoid recession and has had just one negative quarter since then, in early 2003. According to Bloomberg news, Moody's rating service has been sufficiently impressed announce today a hike in the country's credit rating to A2 from A3, where it has been since early 2002. "A2" is Moody's sixth highest rating and in the middle of the "investment grade" spectrum.
| Korea GDP, 2000 Won | 2Q 2007* | 1Q 2007* | 4Q 2006* | Year/ Year | 2006 | 2005 | 2004 |
|---|---|---|---|---|---|---|---|
| Total | 1.7 | 0.9 | 0.9 | 4.9 | 5.0 | 4.2 | 4.7 |
| Private Consumption | 0.8 | 1.5 | 1.0 | 4.1 | 4.2 | 3.6 | -0.3 |
| Gross Fixed Capital Formation | 0.8 | 2.0 | 1.2 | 6.8 | 3.2 | 2.4 | 2.1 |
| Net Exports (Tril.2000.Won) | 20.2 | 19.5 | 21.0 | 19.4 | 19.6 | 16.7 | 14.5 |
| Exports | 4.6 | 3.1 | 0.5 | 10.7 | 12.4 | 8.5 | 19.6 |
| Imports | 4.7 | 5.4 | -0.6 | 12.2 | 11.3 | 7.3 | 13.9 |
| Industry Value Added | |||||||
| Manufacturing | 3.6 | -0.9 | 1.0 | 5.9 | 8.4 | 7.1 | 11.1 |
| Services | 1.1 | 1.2 | 1.2 | 4.5 | 4.2 | 3.4 | 1.9 |

Tom Moeller
AuthorMore in Author Profile »Prior to joining Haver Analytics in 2000, Mr. Moeller worked as the Economist at Chancellor Capital Management from 1985 to 1999. There, he developed comprehensive economic forecasts and interpreted economic data for equity and fixed income portfolio managers. Also at Chancellor, Mr. Moeller worked as an equity analyst and was responsible for researching and rating companies in the economically sensitive automobile and housing industries for investment in Chancellor’s equity portfolio. Prior to joining Chancellor, Mr. Moeller was an Economist at Citibank from 1979 to 1984. He also analyzed pricing behavior in the metals industry for the Council on Wage and Price Stability in Washington, D.C. In 1999, Mr. Moeller received the award for most accurate forecast from the Forecasters' Club of New York. From 1990 to 1992 he was President of the New York Association for Business Economists. Mr. Moeller earned an M.B.A. in Finance from Fordham University, where he graduated in 1987. He holds a Bachelor of Arts in Economics from George Washington University.
More Economy in Brief


