 Global| Mar 22 2006
Mortgage Applications Down Further
by:Tom Moeller
|in:Economy in Brief
Summary
The total number of mortgage applications slumped 1.6% last week and continued the downtrend which began the middle of last year. Since the weekly peak last June, applications are down 36.3%. In March, applications are 2.4% below the [...]

The total number of mortgage applications slumped 1.6% last week and continued the downtrend which began the middle of last year. Since the weekly peak last June, applications are down 36.3%. In March, applications are 2.4% below the February average which fell 6.3% m/m.
Purchase applications reversed the prior week's gain and fell 2.3%. Versus the weekly peak last May purchase applications are down 25.2% and the March level is down 2.0% from the February average.
During the last ten years there has been a 50% correlation between the y/y change in purchase applications and the change in new plus existing single family home sales.
Applications to refinance were off another 0.6% on top of the prior week's 1.9% drop. Since the peak last June refis are down 46.9% and the March level is 2.6% below the February average which fell 2.0% from January.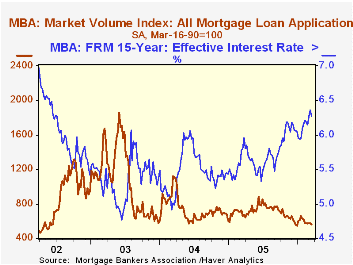
The effective interest rate on a conventional 30-year mortgage jumped for the second week. The nine basis point rise in the effective rate on a 15-year mortgage to 6.36% was to the highest level since mid-2002. The ten basis point rise in the effective rate on a 30 year mortgage pulled it to 6.65%. Interest rates on 15 and 30 year mortgages are closely correlated (>90%) with the rate on 10 year Treasury securities and during the last ten years there has been a (negative) 82% correlation between purchase applications and the effective rate on a 30-Year mortgage.
The Mortgage Bankers Association surveys between 20 to 35 of the top lenders in the U.S. housing industry to derive its refinance, purchase and market indexes. The weekly survey accounts for more than 40% of all applications processed each week by mortgage lenders. Visit the Mortgage Bankers Association site here.
The Yield Curve and Predicting Recessions from the Federal Reserve Board can be found here.
| MBA Mortgage Applications (3/16/90=100) | 03/17/06 | 03/10/06 | Y/Y | 2005 | 2004 | 2003 |
|---|---|---|---|---|---|---|
| Total Market Index | 565.0 | 5574.4 | -14.2% | 708.6 | 735.1 | 1,067.9 |
| Purchase | 393.6 | 403.0 | -11.8% | 470.9 | 454.5 | 395.1 |
| Refinancing | 1,574.5 | 1,583.6 | -30.2% | 2,092.3 | 2,366.8 | 4,981.8 |
by Tom Moeller March 22, 2006
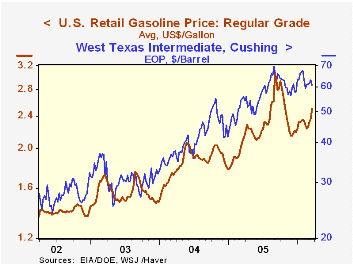
Last week's jump in the U.S. average price for gasoline to $2.50 per gallon lifted prices 13.6% above the yearend 2005 level. This strength certainly reflects some pass through of this year's rise in crude oil prices.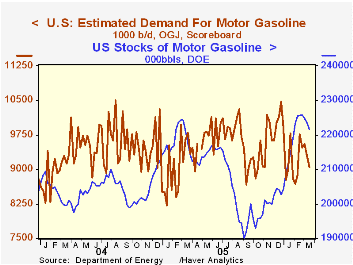
Crude costs are up 4.2% year to date and 8.1% y/y though the spot price for WTI crude at $60.58 is off its high reached earlier in the year of $67.83 per barrel.
Supplies of gasoline, however, are plentiful. Strong imports of motor gasoline (+31.5% y/y) have offset weakness in gasoline production (+1.0% y/y). That has lifted gasoline inventories 17.8% (1.1% y/y) from the low early last September. (These figures are available in the Haver OILWKLY database.)
Drivers seem to be growing accustomed to higher gasoline prices. Since last year the four week average level of gasoline consumption, through early March, rose 0.6%.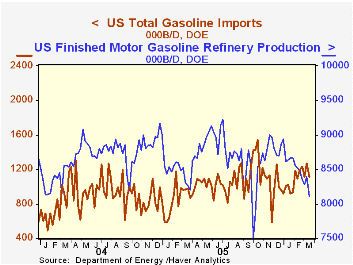
The just-released figures from the Federal Highway Administration (MVMPM@USECON in the Haver database) indicate that passenger car miles driven during 2004 rose 2.0% from the year prior and rose 20.4% during the last ten years.
Reducing Gasoline Consumption: Three Policy Options is a 2002 study from the Congressional Budget Office.
The Annual Energy Outlook 2006 with Projections to 2030 from the U.S. Energy Information Administration is available here.
| Weekly Prices | 03/20/06 | 12/27/05 | Y/Y | 2005 | 2004 | 2003 |
|---|---|---|---|---|---|---|
| US Retail Gasoline Price per Gallon | $2.50 | $2.20 | 18.7% | $2.27 | $1.85 | $1.56 |
| Light Sweet Crude Oil, WTI (per bbl.) | $60.58 | $58.16 | 8.1% | $58.16 | $41.78 | $32.78 |
by Carol Stone March 22, 2006
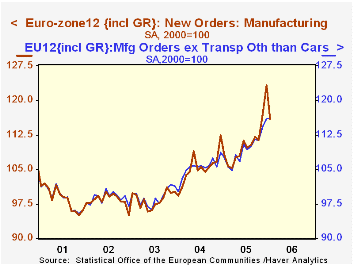
New orders for manufactured goods in Euro-Zone countries fell 5.9% in January, according to a report published today by Eurostat. This drop followed sizable increases of 4.9% and 5.3% in November and December, respectively, however, and the year-on-year gain is a hefty 9.7%.
Much of the month-to-month movement is due to transport equipment, particularly ships and aircraft. As seen in the table below, this category, comprising NACE industry groups 34 and 35, surged 10%+ in each November and December, so a 14.4% drop in January is hardly surprising. In fact, a new subtotal devised by Eurostat excludes NACE 35: ships, railroad equipment and aircraft. This segment's orders rose a mere 0.2% in January, although prior strength means those orders were up a substantial 10.7% from January 2005.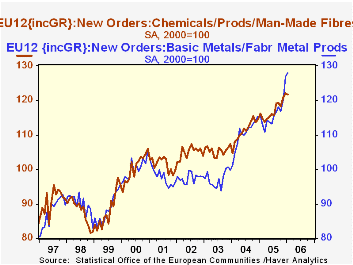
These gains in orders have to be encouraging for European business leaders and policymakers. As we have reported here recently, industrial production itself is mixed at best, with stagnation characterizing many of the nations in that region. Employment has continued a downward trend in several majors countries, even while uptrends are starting to develop in others. These basic indicators, though, show that steps toward growth are tenuous.
So orders have begun to look better. Further, a diversity of industries is participating. As seen below, chemicals and machinery both have increasing order books, and textiles and wood products do as well.Notably, then, it is beneficial to look beyond headline series to details of these indicator reports to assess the current position of an industry or even of an entire regional economy.
| SA, Indexes, 2000=100, % chg | Jan 2006 | Dec 2005 | Nov 2005 | Year/Year* | 2005* | 2004* | 2003* |
|---|---|---|---|---|---|---|---|
| Total | -5.9 | 5.3 | 4.9 | 9.7 | 4.6 | 7.3 | 0.2 |
| Total ex NACE 35** | 0.2 | 1.5 | 2.7 | 10.7 | 3.7 | 6.5 | 0.3 |
| Selected Industries: | |||||||
| Transport Equip. | -14.4 | 10.6 | 10.4 | 11.2 | 6.0 | 10.5 | 0.8 |
| Chemicals & Products | -0.3 | 1.0 | 2.3 | 7.1 | 4.9 | 5.5 | 0.5 |
| Machinery & Equipment | 1.9 | -0.8 | 0.2 | 10.8 | 5.6 | 6.8 | -1.4 |

Tom Moeller
AuthorMore in Author Profile »Prior to joining Haver Analytics in 2000, Mr. Moeller worked as the Economist at Chancellor Capital Management from 1985 to 1999. There, he developed comprehensive economic forecasts and interpreted economic data for equity and fixed income portfolio managers. Also at Chancellor, Mr. Moeller worked as an equity analyst and was responsible for researching and rating companies in the economically sensitive automobile and housing industries for investment in Chancellor’s equity portfolio. Prior to joining Chancellor, Mr. Moeller was an Economist at Citibank from 1979 to 1984. He also analyzed pricing behavior in the metals industry for the Council on Wage and Price Stability in Washington, D.C. In 1999, Mr. Moeller received the award for most accurate forecast from the Forecasters' Club of New York. From 1990 to 1992 he was President of the New York Association for Business Economists. Mr. Moeller earned an M.B.A. in Finance from Fordham University, where he graduated in 1987. He holds a Bachelor of Arts in Economics from George Washington University.
More Economy in Brief


