 Global| Aug 25 2006
Monetary Policy's Posture: Many "Buts"
by:Tom Moeller
|in:Economy in Brief
Summary
The dissenting opinion at the last FOMC meeting from Richmond Fed Bank President Lacker no doubt reflected more than a concern that economic growth was still too robust to be consistent with moderate inflation, but that various [...]
The dissenting opinion at the last FOMC meeting from Richmond Fed Bank President Lacker no doubt reflected more than a concern that economic growth was still too robust to be consistent with moderate inflation, but that various measures of liquidity (money) growth needed further restraint.
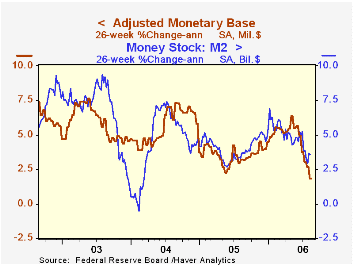
Indeed, liquidity growth has slowed. Six-month growth in the monetary base near 2% (AR) is off the 6% highs, but M2 has not slowed as precipitously and recently has picked up some.
The 5-Year TIPS spread is down, but only to the middle of the range of the last year and the futures market is indicating that the forward inflation rate is in a rising trend.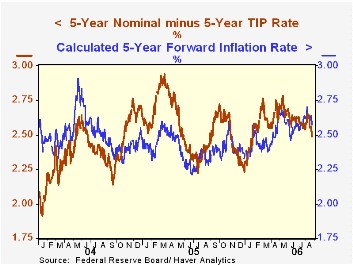
The dollar's value received some lift as the Fed was tightening, but the inkling and then the reality of a pause in the process recently caused the dollar's foreign exchange value to fall back near the bottom of its 18 month range.
Commodity prices. They've had some lift due to higher oil prices and the industrial economy's recovery but the patterns showing strength have been uneven, and these prices in the past have been better indicators of real activity than of inflationary pressure.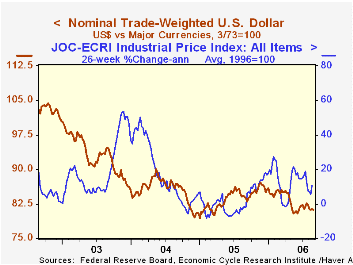
Inflation expectations as measured in the University of Michigan survey rose in August to 4.9% for the next twelve months, up off the 2.5% lows of the 2003, but down from last year's highs of 5.5%.
The effects of globalization on inflation and their implications for monetary policy: a speech by Fed Vice Chairman Donald L. Kohn is available here.
The long run benefits of sustained low inflation from the Federal Reserve Bank of St. Louis can be found here.
New CPI Shows Smaller Upturn in Japanese Inflationby Carol Stone August 25, 2006
The Japanese Ministry of Internal Affairs and Communications (MIC) today released its five-year revision of the consumer price index. Analysts and media reporters were surprised to find a larger downward revision than projected and a weaker report for July.
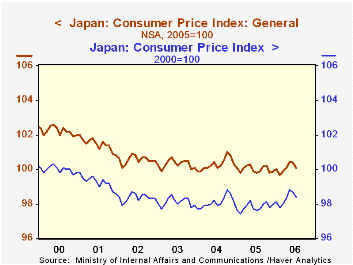
The General CPI, seasonally adjusted, fell 0.1% in July, leaving it just 0.3% ahead of July 2005. The decline was largest in food, especially fresh food, but there were also slight decreases in utilities, furniture & other household goods and reading & recreation. Clothing prices went down, but it appears that that is usual in July. Transportation costs were up, but by less than in July last year. Data for the individual categories are not seasonally adjusted.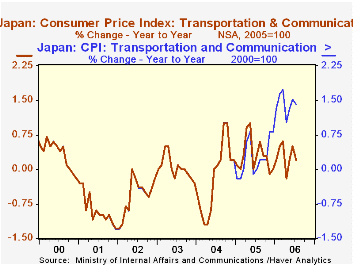
MIC also updated its former configuration of the CPI for July; this index also decreased 0.1% for the month, but it was up 0.8% from a year ago. It is the difference of 0.5% between the old and new series that was striking to economists and others, many of whom were speculating after the release that the downward revision would stop the Bank of Japan from raising interest rates again this year.
The revision involves basically two changes. One is numerical: the base period is changed from 2000=100 to 2005=100. While it sounds simple, this change can have a substantive impact, as the magnitude of individual components may shift dramatically if their prices have changed dramatically. Thus, as MIC points out in accompanying "Frequently Asked Questions", the computer index on the previous base was 16 for 2005, but now it is 100, that is, more than six times larger. Since those prices are still falling, that provides a larger downward force on the index.
The other change involves rearranging the market basket of goods and services. Consumers obviously shift their spending patterns, particularly over a five-year span. So weights in the index change according to the results of one of the standard surveys taken in Japan, the Family Income and Expenditure Survey. This time, weights increased for items whose prices had fallen sharply, also biasing downward the new total index; the example cited by MIC is mobile telephone charges, whose weight rose from 74/10000 to 208/10000, that is, by nearly three times. The resulting change in the transportation and communication category is seen in the second graph. In addition, some items were dropped all together and others added. This time around the new items include ones where prices are falling, such as LCD TV sets; these are part of "Reading and Recreation", illustrated in the third graph. Overall, 34 items were added to the CPI basket and 48 items were dropped. It's a sign of the times in Japan that one category of rice was among the deleted items, along with the low tables used when sitting on the floor. Some hand-rolled sushi was deleted, while "conveyor belt" sushi was added.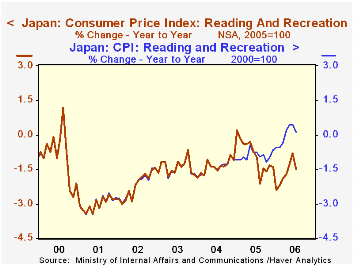
It will obviously be up to the Bank of Japan to interpret the effect of these changes on its policy decisions. Most importantly, the lower price index does not come from weak demand, but from vigorous demand amidst rapidly changing technology. What should be the response of interest rates to such developments? It's a good question.
A technical note is appropriate on the historical data in these indexes. MIC released detailed data back only through January 2005 and published some broader groups back through July 2004. That agency and Nomura Research Institute, which provides the data to Haver Analytics, along with ourselves, have all spliced historical values onto the short period of new data in order to provide longer time series. So far the only change in the earlier components is their rebasing from 2000 to 2005. More calculation to factor in the new item mix is needed to make this history more comparable with the recent values. As MIC, working from its source price data, provides this history, we will be over-writing the temporary historical values currently in our database. Users should note that the data values prior to 2005 could change noticeably, and we recommend caution in drawing overly firm conclusions from them. Further, seasonal adjustment of even the available data has yielded awkward-appearing series, and we would also advise careful attention to those figures as well.
| Japan: % Changes | July 2006 | June 2006 | May 2006 | Year Ago | 2005 | 2004 | 2003 |
| General CPI - New* | 100.2 | 100.3 | 100.2 | 99.9 | 100.0 | 100.3 | 100.3 |
| -0.1 | 0.1 | 0.1 | 0.3 | -0.3 | 0 | -0.3 | |
| General CPI - Old* | 98.5 | 98.6 | 98.6 | 97.7 | 97.8 | 98.1 | 98.1 |
| -0.1 | 0.0 | 0.3 | 0.8 | -0.3 | 0 | -0.3 | |
| CPI less Fresh Food - New | 0.2** | 0.2** | 0.0** | -- | -0.1 | -0.1 | -0.3 |
| CPI less Fresh Food - Old | 0.6** | 0.6** | 0.6** | -- | -0.1 | -0.1 | -0.3 |
| Japan: % Changes | July 2006 | June 2006 | May 2006 | Year Ago | 2005 | 2004 | 2003 |
|---|---|---|---|---|---|---|---|
| General CPI - New* | 100.2 | 100.3 | 100.2 | 99.9 | 100.0 | 100.3 | 100.3 |
| -0.1 | 0.1 | 0.1 | 0.3 | -0.3 | 0 | -0.3 | |
| General CPI - Old* | 98.5 | 98.6 | 98.6 | 97.7 | 97.8 | 98.1 | 98.1 |
| -0.1 | 0.0 | 0.3 | 0.8 | -0.3 | 0 | -0.3 | |
| CPI less Fresh Food - New | 0.2** | 0.2** | 0.0** | -- | -0.1 | -0.1 | -0.3 |
| CPI less Fresh Food - Old | 0.6** | 0.6** | 0.6** | -- | -0.1 | -0.1 | -0.3 |

Tom Moeller
AuthorMore in Author Profile »Prior to joining Haver Analytics in 2000, Mr. Moeller worked as the Economist at Chancellor Capital Management from 1985 to 1999. There, he developed comprehensive economic forecasts and interpreted economic data for equity and fixed income portfolio managers. Also at Chancellor, Mr. Moeller worked as an equity analyst and was responsible for researching and rating companies in the economically sensitive automobile and housing industries for investment in Chancellor’s equity portfolio. Prior to joining Chancellor, Mr. Moeller was an Economist at Citibank from 1979 to 1984. He also analyzed pricing behavior in the metals industry for the Council on Wage and Price Stability in Washington, D.C. In 1999, Mr. Moeller received the award for most accurate forecast from the Forecasters' Club of New York. From 1990 to 1992 he was President of the New York Association for Business Economists. Mr. Moeller earned an M.B.A. in Finance from Fordham University, where he graduated in 1987. He holds a Bachelor of Arts in Economics from George Washington University.
More Economy in Brief


