 Global| Jan 19 2010
Misery Reaches Highest Since 1983
by:Tom Moeller
|in:Economy in Brief
Summary
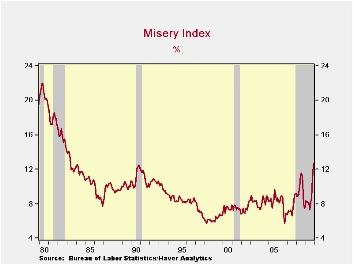
The U.S. economic recession brought with it the highest level of misery in over twenty five years. The December misery index reached 12.7% which was up from 11.8% during November. The index is calculated as the sum of the unemployment [...]
 The
U.S.
economic recession brought with it the highest level of misery in over
twenty five years. The December misery index reached 12.7% which was up
from 11.8% during November. The index is calculated as the sum of the
unemployment rate and the y/y change in the consumer price index. Not
only was the index level its highest since 1983, but the 5.2 point
increase versus December '08 was the quickest since the "credit crunch"
recession of 1980.
The
U.S.
economic recession brought with it the highest level of misery in over
twenty five years. The December misery index reached 12.7% which was up
from 11.8% during November. The index is calculated as the sum of the
unemployment rate and the y/y change in the consumer price index. Not
only was the index level its highest since 1983, but the 5.2 point
increase versus December '08 was the quickest since the "credit crunch"
recession of 1980.
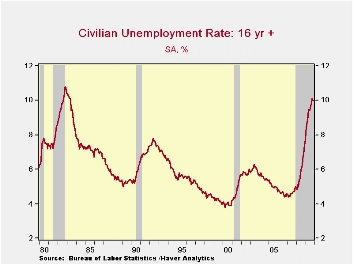
Higher unemployment accounts the index's stretch into double digits. At 10.0%, not only is the unemployment rate high but its 2.6 percentage point increase over the last twelve months is nearly the quickest since 1975. (Before the current reading, the 4.0 point rise as of June set the record.)
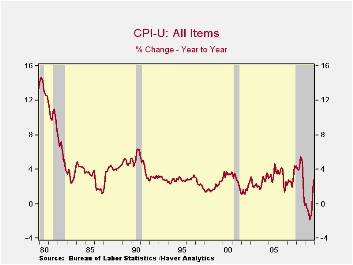
Low inflation has ameliorated some of the pain caused by higher unemployment, but the positive effect is about to diminish. The 2.8% gain in the CPI versus last year was down sharply from the 1980 peak of 14.6% when oil prices spiked. However, the misery index soon will reflect the increase in energy prices.
The Misery Index is calculated by Haver Analytics. It is the sum of the unemployment rate and the year-over-year percentage change in the CPI-U from the Bureau of Labor Statistics.· The Fed's Monetary Policy Response to the Current Crisis is from the San Francisco Federal Reserve published last May and it can be found here.
| December | November | December '08 | 2009 | 2008 | 2007 | |
|---|---|---|---|---|---|---|
| Misery Index (%) | 12.7 | 11.8 | 7.5 | 8.9 | 9.7 | 7.5 |
| Unemployment Rate (%) | 10.0 | 10.0 | 7.4 | 9.3 | 5.8 | 4.6 |
| Consumer Prices (Y/Y %) | 2.7 | 1.8 | 0.1 | -0.4 | 3.8 | 2.9 |
by Louise Curley January 19, 2010
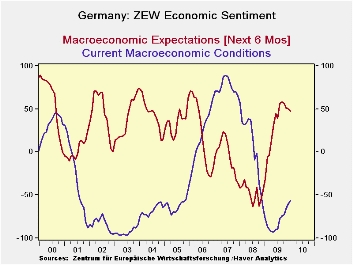 According
to
the January ZEW indicator, the percentage of German investors and
analysts optimistic about the outlook six months ahead declined for the
fourth month. The percent balance is now 47.2% compared with
the recent peak of 57.7% in September, however, it is still well above
the long term average of 27.1%. At the same time, more of
these investors see improvement in current conditions although the
pessimists still outweigh the optimists. The percent balance
between those who see improvement in current conditions and those who
see deterioration was -56.6% in January, 2010, compared with -60.6% in
December and the peak of -92.8% in May of 2009. The disparity
between the participants' views of current conditions and expectations
is not unusual as can be seen in the first chart.
According
to
the January ZEW indicator, the percentage of German investors and
analysts optimistic about the outlook six months ahead declined for the
fourth month. The percent balance is now 47.2% compared with
the recent peak of 57.7% in September, however, it is still well above
the long term average of 27.1%. At the same time, more of
these investors see improvement in current conditions although the
pessimists still outweigh the optimists. The percent balance
between those who see improvement in current conditions and those who
see deterioration was -56.6% in January, 2010, compared with -60.6% in
December and the peak of -92.8% in May of 2009. The disparity
between the participants' views of current conditions and expectations
is not unusual as can be seen in the first chart.
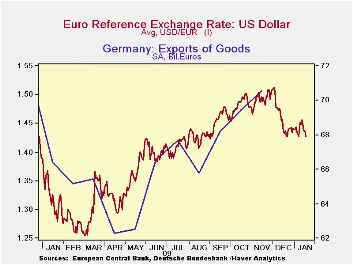
The impact on the Euro Area of the financial difficulties in Greece that have come to the surface during the survey period may have had some dampening effect on expectations and outweighed some of the more favorable economic developments. Over the past month or so, the Euro has declined 5.5% from $1.5120 to $1.4279 today and exports continue to rise. The second chart shows the movement in the Euro on a daily basis and the trend in monthly exports over the past year.
Along with the improvement in the appraisal of current conditions there has been a general improvement in the outlook for profits in the 13 industries that ZEW monitors. The positive appraisal for profits in Banking, Chemical, Steel/Metal, Electronic, Machinery, Utilities, Service, Telecommunications, and Information Technology industries increased in January and the negative percent balance for profits in the Vehicles/Automotive industry was reduced. The percent balances on only three industries declined--Insurance, Consumption/Trade and Construction in January, but the profit outlook in these industries has shown improvement since the low point reached in October 2008 as can be seen in the third chart. There are now only two industries where the percent balances on the profit outlook are negative--Consumption/Trade (-12.1%) and Vehicles/Automotive (-23.2%).

| ZEW INDICATORS (% Balance) | Jan 10 | Dec 09 | Nov 09 | Oct 09 | Sep 09 | Aug 09 | July 09 | June 09 | May 09 |
|---|---|---|---|---|---|---|---|---|---|
| Current Conditions | -56.6 | -60.6 | -65.6 | -72.2 | -74.0 | -77.2 | -88.3 | -89.7 | 92.8 |
| Expectations 6 Months Ahead | 47.2 | 50.4 | 51.1 | 56.0 | 57.7 | 56.1 | 39.5 | 44.8 | 31.1 |
by Tom Moeller January 19, 2010
 According
to The National Association of Home Builders, housing market activity
slipped again from its earlier improved level. The
Association reported that its January Composite Housing
Market Index edged lower to 15 from 16 in December and from 19 last
September. Nevertheless, the index remained nearly double the low of 8
last January. The index is compiled from survey questions asking
builders to rate market conditions as “good”, “fair”, “poor” or “very
high” to “very low”. The figure is a
diffusion index, therefore, numerical results over 50 indicate a
predominance of “good” readings. In the West the index fell hard to a
reading of 16 from 19 in December but remained up by four times since
January '09. In all other regions the m/m declines were moderate and
levels remained up sharply from January 2009.
According
to The National Association of Home Builders, housing market activity
slipped again from its earlier improved level. The
Association reported that its January Composite Housing
Market Index edged lower to 15 from 16 in December and from 19 last
September. Nevertheless, the index remained nearly double the low of 8
last January. The index is compiled from survey questions asking
builders to rate market conditions as “good”, “fair”, “poor” or “very
high” to “very low”. The figure is a
diffusion index, therefore, numerical results over 50 indicate a
predominance of “good” readings. In the West the index fell hard to a
reading of 16 from 19 in December but remained up by four times since
January '09. In all other regions the m/m declines were moderate and
levels remained up sharply from January 2009.
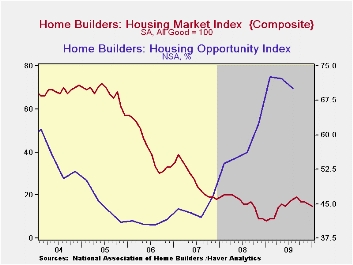
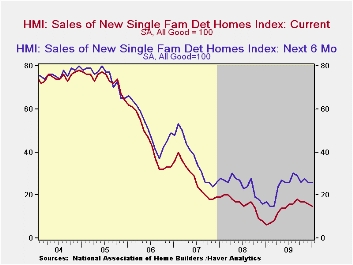
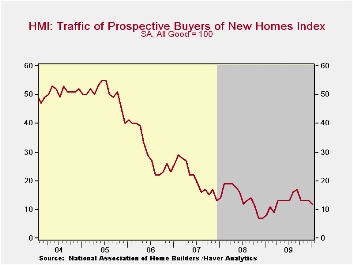
The present sales index slipped to 15 which was down from the August high but the sub-index of sales during the next six months held steady m/m. Improvement from 2009 was moderate. The Home Builders' Association also reported that traffic of prospective buyers slipped from December to the lowest level since March.
The Home Builders' Housing Opportunity Index, which is the share of homes sold that could be considered affordable to a family earning the median income, fell in 3Q '09 to 70.1%. It had jumped earlier to a record high of 72.5% buoyed by lower home prices, lower interest rates and higher income. (There is a break in the series from 2002 to 2003.)
The NAHB has compiled the Housing Market Index since 1985. The weights assigned to the individual index components are .5920 for single family detached sales, present time; .1358 for single family detached sales, next six months; and .2722 for traffic of prospective buyers. The results, along with other housing and remodeling indexes from NAHB Economics, are included in Haver’s SURVEYS database.
| Nat'l Association of Home Builders | January | December | November | January '09 | 2009 | 2008 | 2007 |
|---|---|---|---|---|---|---|---|
| Composite Housing Market Index (All Good=100) | 15 | 16 | 17 | 8 | 15 | 16 | 27 |
| Single-Family Sales | 15 | 16 | 17 | 6 | 13 | 16 | 27 |
| Single-Family Sales: Next Six Months | 26 | 26 | 28 | 17 | 24 | 25 | 37 |
| Traffic of Prospective Buyers | 12 | 13 | 13 | 8 | 13 | 14 | 21 |

Tom Moeller
AuthorMore in Author Profile »Prior to joining Haver Analytics in 2000, Mr. Moeller worked as the Economist at Chancellor Capital Management from 1985 to 1999. There, he developed comprehensive economic forecasts and interpreted economic data for equity and fixed income portfolio managers. Also at Chancellor, Mr. Moeller worked as an equity analyst and was responsible for researching and rating companies in the economically sensitive automobile and housing industries for investment in Chancellor’s equity portfolio. Prior to joining Chancellor, Mr. Moeller was an Economist at Citibank from 1979 to 1984. He also analyzed pricing behavior in the metals industry for the Council on Wage and Price Stability in Washington, D.C. In 1999, Mr. Moeller received the award for most accurate forecast from the Forecasters' Club of New York. From 1990 to 1992 he was President of the New York Association for Business Economists. Mr. Moeller earned an M.B.A. in Finance from Fordham University, where he graduated in 1987. He holds a Bachelor of Arts in Economics from George Washington University.
More Economy in Brief


