 Global| Nov 21 2007
Michigan Consumer Sentiment Remained Depressed
by:Tom Moeller
|in:Economy in Brief
Summary
The University of Michigan's consumer sentiment index for the full month of November held at the mid-month level of 75.0. That was down 7.3% from October and it pulled the average so far in 4Q 9.0% below the 3Q average. Consensus [...]
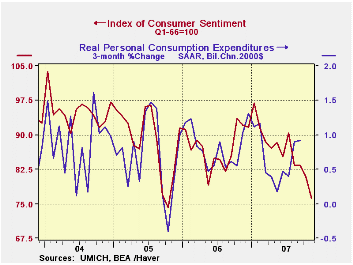
The University of Michigan's consumer sentiment index for the full month of November held at the mid-month level of 75.0. That was down 7.3% from October and it pulled the average so far in 4Q 9.0% below the 3Q average. Consensus expectations for November were for stability with the mid-month reading of 75.0.
Both major sub-indexes were down sharply for the month. The current conditions index declined to 91.0 from October's 97.6, the weakest since March 2003. Expectations fell to 64.7 from 70.1 in October, the lowest reading since October 2005.
Current buying conditions compared to one year ago fell by half from where it was last year and the expected change in business conditions in the next 12 months also fell sharply. Current personal finances fell 9.0% and expectations for personal finances also fell. One-year expectations for business conditions fell but expectations for the next five years improved slightly from October's depressed level.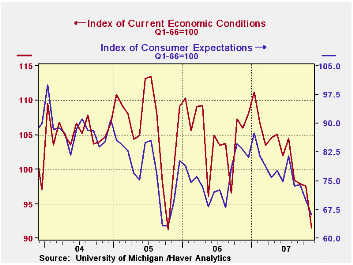
Expectations for inflation during the next twelve months jumped to 4.3% from 3.7% in October. The 2006 expectations were for 3.9% inflation this year. For the next five to ten years expectations were for a 3.4% rise in prices, equal to the expectation logged last year.
The University of Michigan survey is not seasonally adjusted.The reading is based on telephone interviews with about 500 households at month-end; the mid-month results are based on about 300 interviews. The summary indexes are in Haver's USECON database, with details in the proprietary UMSCA database.
The minutes of the latest Federal Open Market Committee Meeting can be found here.
| University of Michigan | Nov ( Final) | Nov (Prelim) | Oct | Nov y/y | 2006 | 2005 | 2004 |
|---|---|---|---|---|---|---|---|
| Consumer Sentiment | 75.0 | 75.0 | 80.9 | -18.6% | 87.3 | 88.5 | 95.2 |
| Current Conditions | 91.0 | 91.0 | 97.6 | -14.2% | 105.1 | 105.9 | 105.6 |
| Expectations | 64.7 | 64.7 | 70.1 | -22.2% | 75.9 | 77.4 | 88.5 |
by Carol Stone November 21, 2007
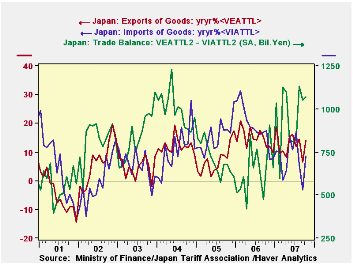
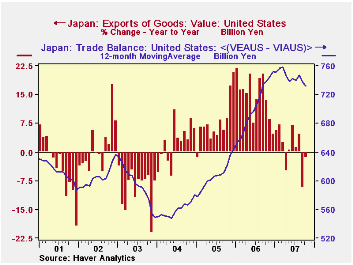
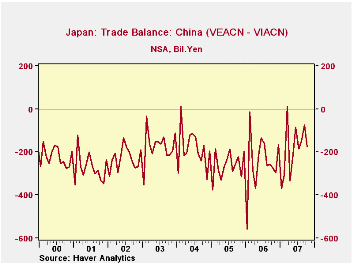
Japan's trade balance widened in October, slightly from September and more noticeably from a year ago. The October surplus was ¥1,073 billion, up from ¥1,051 billion in September and ¥933 in October 2006, all calculated from the Ministry of Finance's seasonally adjusted data. Before seasonal adjustment, the surplus was ¥1,013 billion compared with just ¥613 billion the year earlier.Exports strengthened anew, following some moderation in September; they increased ¥124 billion from September to ¥7,179 billion after falling ¥192 billion then from August. They were up 13.9% from a year ago. Chemicals, manufactured goods, non-electrical machinery and "other" all grew more than the total, while the largest contribution came from motor vehicles. They were up 21.3% year/year or ¥235 billion. Imports rose ¥103 billion in October to ¥6,106 billion, seasonally adjusted, yielding a third consecutive yearly increase less than 10%, this one 8.6% or ¥513 billion. More than half of this increase was "mineral fuels", ¥278 billion. Thus, ironically this month, the rise in oil imports was almost completely covered by an increase in exports of motor vehicles.The trade pattern among various countries has been interesting. The trade surplus with the US is diminishing due to smaller exports. From yearly growth averaging ¥177 billion per month in 2006, the 12 months through October saw just a ¥26 billion average increase with September down from a year ago by ¥146 billion and October down ¥23 billion.This has reduced the surplus from ¥783 billion in October 2006 to ¥717 billion this October. In contrast, the deficit with China is decreasing as Japanese exports there are up 19.3% from a year ago, while imports have increased only 7.2%. There was a similar move in October with the EU, although the trend there is for a growing surplus. October exports to Europe surged 24% while imports rose only 9.8%. This yielded a nice increase in the surplus to ¥476 billion from ¥315 billion in October 2006.
| JAPAN, Bil.¥ | Oct 2007 | Sept 2007 | Aug 2007 | Year Ago | Monthly Averages | ||
|---|---|---|---|---|---|---|---|
| 2006 | 2005 | 2004 | |||||
| Trade Balance | 1,073 | 1,051 | 1,133 | 933 | 658 | 726 | 996 |
| Exports, SA* | 7,179 | 7,054 | 7,247 | 6,448 | 6,271 | 5,471 | 5,097 |
| Yr/Yr %Chg | 13.9% | 6.5% | 14.5% | -- | 14.6% | 7.3% | 12.1% |
| Imports, SA* | 6,106 | 6,003 | 6,114 | 5,756 | 5,612 | 4,746 | 4,101 |
| Yr/Yr %Chg | 8.6% | -3.2% | 5.8% | -- | 18.3% | 15.7% | 10.9% |
by Tom Moeller November 21, 2007
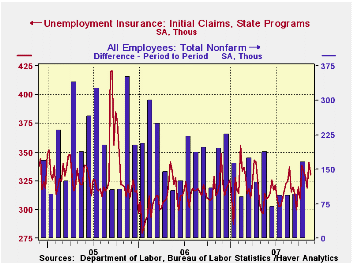
Initial claims for unemployment insurance fell back 11,000 last week to 330,000 after a 22,000 jump during the week prior. That was a slightly greater increase than originally indicated. A claims level of 330,000 had been expected for the latest week. There were no special factors indicated as having influenced the figures.
The latest figure is for the survey week for November nonfarm payrolls and claims fell 9,000 (2.7%) from the October period.
A claims level below 400,000 typically has been associated with growth in nonfarm payrolls. During the last six years there has been a (negative) 78% correlation between the level of initial claims and the m/m change in nonfarm payroll employment.
The four week moving average of initial claims dipped slightly to 329,750 (3.2% y/y).
The largest increases in initial claims for the week ending
Nov. 10 were in Michigan (+6,895), California (+5,696), Puerto Rico
(+3,745), New Jersey (+2,726), and New York (+2,394), while the largest
decreases were in Iowa (-2,397), Ohio (-1,558), North Carolina (-870),
South Carolina (-809), and Georgia (-482).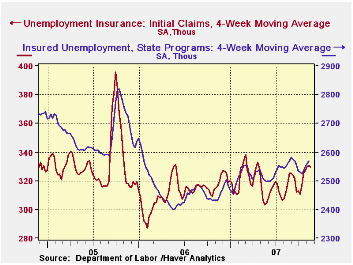
Continuing claims for unemployment insurance rose 7,000 after a 16,000 worker decline that was slightly deeper than initially reported.
The continuing claims numbers lag the initial claims figures by one week.
The insured rate of unemployment was again stable at 1.9%.
Labor Force Participation and the Prospects for U.S. Growth from the Federal Reserve Bank of Bank of San Francisco is available here.
| Unemployment Insurance (000s) | 11/17/07 | 11/10/07 | Y/Y | 2006 | 2005 | 2004 |
|---|---|---|---|---|---|---|
| Initial Claims | 330 | 341 | 2.5% | 313 | 331 | 343 |
| Continuing Claims | -- | 2,566 | 5.7% | 2,459 | 2,662 | 2,924 |

Tom Moeller
AuthorMore in Author Profile »Prior to joining Haver Analytics in 2000, Mr. Moeller worked as the Economist at Chancellor Capital Management from 1985 to 1999. There, he developed comprehensive economic forecasts and interpreted economic data for equity and fixed income portfolio managers. Also at Chancellor, Mr. Moeller worked as an equity analyst and was responsible for researching and rating companies in the economically sensitive automobile and housing industries for investment in Chancellor’s equity portfolio. Prior to joining Chancellor, Mr. Moeller was an Economist at Citibank from 1979 to 1984. He also analyzed pricing behavior in the metals industry for the Council on Wage and Price Stability in Washington, D.C. In 1999, Mr. Moeller received the award for most accurate forecast from the Forecasters' Club of New York. From 1990 to 1992 he was President of the New York Association for Business Economists. Mr. Moeller earned an M.B.A. in Finance from Fordham University, where he graduated in 1987. He holds a Bachelor of Arts in Economics from George Washington University.
More Economy in Brief


