 Global| Dec 12 2008
Michigan Consumer Sentiment Recovered Slightly
by:Tom Moeller
|in:Economy in Brief
Summary
The mid-December reading of consumer sentiment from the University of Michigan recovered slightly from the the dismal November level. At 59.1 the figure was up 6.9% from November and it was the highest level since September. It still [...]
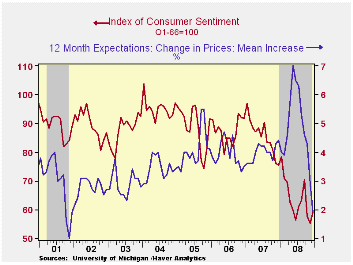
The mid-December reading of consumer sentiment from the University of Michigan recovered slightly from the the dismal November level. At 59.1 the figure was up 6.9% from November and it was the highest level since September. It still was down, however, by nearly one quarter from last year. The reading for December beat Consensus expectations for 55.0.
During the last ten years there has been a 55% correlation between the level of sentiment and the three-month change in real consumer spending.
Weak prices most likely pushed up the index of buying
conditions for
large household goods by one-third from November. The view of current
personal finances improved slightly from November's record low level,
and the figure remained off by nearly one half from last year's
average. 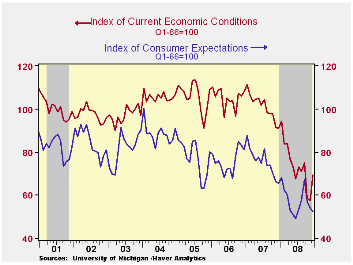
The expectations component of consumer sentiment continued to
fall.
A 2.8% m/m decline returned the series to nearly its lowest since 1990
and close to the low of 1980. Expectations for business conditions
during the next year did drop to the lowest since 1980 and expectations
for conditions during the next five years fell as well. The expected
change in personal finances improved slightly for the second
consecutive month.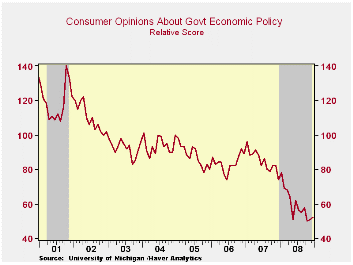
The opinion of government policy, which apparently influences economic expectations, ticked up slightly for the second month (-29.7% y/y). A higher 42% thought that a fair job was being done but a lesser 4% thought that a good job was being done. That was nearly the lowest percentage on record.
Recent economic weakness and lower oil prices caused inflation expectations to fall. The mean expected rate of inflation during the next year fell further to 1.9%. It was as high as 7.0% in May. The expected inflation rate during the next five years fell to 2.7%, a record low for the series which dates back to 1980.
The University of Michigan survey is not seasonally adjusted.The reading is based on telephone interviews with about 500 households at month-end; the mid-month results are based on about 300 interviews. The summary indexes are in Haver's USECON database, with details in the proprietary UMSCA database.
| University of Michigan | Mid-December | November | October | December y/y | 2007 | 2006 | 2005 |
|---|---|---|---|---|---|---|---|
| Consumer Sentiment | 59.1 | 55.3 | 57.6 | -21.7% | 85.6 | 87.3 | 88.5 |
| Current Conditions | 69.4 | 57.5 | 58.4 | -23.7 | 101.2 | 105.1 | 105.9 |
| Expectations | 52.4 | 53.9 | 57.0 | -20.1 | 75.6 | 75.9 | 77.4 |
by Carol Stone December 12, 2008
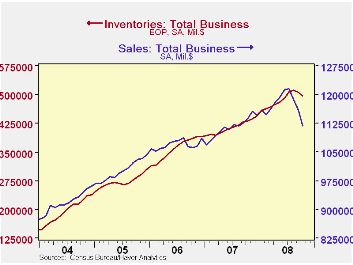
October business inventories dropped 0.6% from September. That month, in turn, was revised from a 0.2% decline to 0.4%. Total business sales -- manufacturers, wholesalers and retailers -- dropped a whopping 3.5% in October, following a 2.4% decline in September and 2.2% in August. So despite the reduction in inventories, the big drops in sales mean that the inventory/sales ratio increased to 1.34 in October from 1.30 and 1.27 in September and August, respectively. While 1.34 is not high by historical standards -- it was in fact always higher that than prior to mid-2003 -- the two successive monthly increases in the ratio indicate the worst deterioration in the aggregate inventory position since the midst of the 1981-82 recession.
Manufacturers' stocks fell 0.6% in October and the previous
month
was revised down slightly, making a 0.8% drop instead of 0.7% reported
initially. The combined decline of 1.4% basically reverses the 1.2%
increase of the prior two months.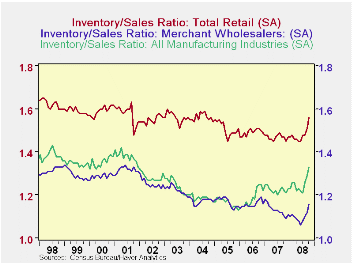
Inventories at wholesalers plunged 1.1% in the latest month, following 0.4% the month before, also producing a 1.4% drop over the two months. As Tom Moeller pointed out here a month ago, these moves have been heavily influenced by falling petroleum prices, as "tank farms" are included among the rolls of wholesalers. However, large as these price declines have been, they didn't account for the entire decline in wholesale inventories, which otherwise was still 0.4% in October and 0.3% in September.
At retailers, stocks edged down just 0.1%, following a 0.2%
increase
in September and a 0.7% decline in August. Here, of course, it's the
motor vehicle sector that pushes things around the most. But recent
anecdotes about dealers running out of parking lot for all of their
unsold merchandise, even if true on a broad scale, are too recent to be
covered in these data. In this report, inventories show little change,
down 0.4% in September and just 0.1% in October. Among other retailers,
inventories rose 0.4% in September but then also declined 0.1% in
October. The weaker October sales meant that the inventory/sales ratio
rose, though, to 1.32 from 1.28 in September, the largest
month-to-month increase since December 1991.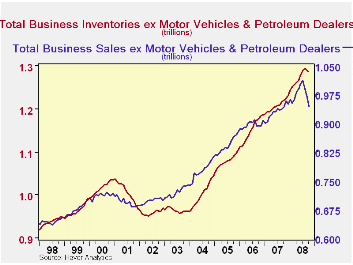
Since petroleum prices are so important at this time, we made
some
calculations subtracting sales of petroleum products from wholesale and
retail sectors and also netting out the relevant inventories. We're
disappointed to see that the resulting sales figure is still down 2.5%,
even as inventories fall just 0.4% for October. So the I/S ratio still
rises sharply, to 1.36 months from 1.33 in September and 1.27 back in
July. Possibly lower interest rates will help businesses finance these
inventory positions, cushioning the blow to production that such an
increase in the overhang might portend. But one thing we have learned
in recent months is that it's best not to draw a firm conclusion on
this.
| Business Inventories | Oct | Sept | August | Y/Y | 2007 | 2006 | 2005 |
|---|---|---|---|---|---|---|---|
| Total | -0.6% | -0.4% | 0.2% | 4.6% | 3.8% | 5.9% | 6.0% |
| Retail | -0.1% | 0.2% | -0.7% | 0.1% | 2.6% | 3.5% | 2.3% |
| Retail excl. Auto | -0.1% | 0.4% | -0.2% | 1.3% | 2.7% | 4.9% | 3.9% |
| Wholesale | -1.1% | -0.1% | 0.6% | 8.0% | 5.5% | 8.3% | 7.3% |
| Manufacturing | -0.6% | -0.8% | 0.7% | 6.2% | 3.7% | 6.4% | 8.9% |
by Tom Moeller December 12, 2008
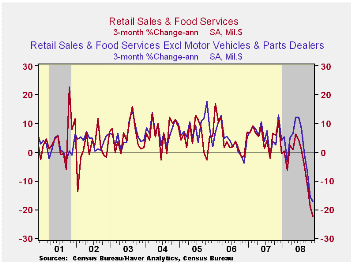
This morning the Commerce Department reported that retail sales fell for the fifth consecutive month. The 1.8% November decline followed declines during October and September that were slightly greater than reported initially. Lower vehicle sales and lower gasoline prices accounted for last month's sales' decline. Elsewhere sales ticked higher, the first rise in the last four months. The latest shortfall in overall sales about matched Consensus expectations. The retail sales data are available in Haver's USECON database.
Motor vehicle & parts sales dropped 2.8% after declines of roughly 5.5% during both of the prior two months. As a result of these outsized declines, sales last month were down by one quarter from their year-ago level. The decline is less than the 36.7% y/y drop reported in unit sales of motor vehicles.
Lower prices pulled dollar sales at gasoline service stations
down
by 14.7% month-to-month and by nearly one-quarter from last year as
gasoline prices fell 29.6% m/m to an average of $2.15 per gallon.
Another downward leg is in store for December sales given that gasoline
prices already have fallen 21% from their November average to $1.70.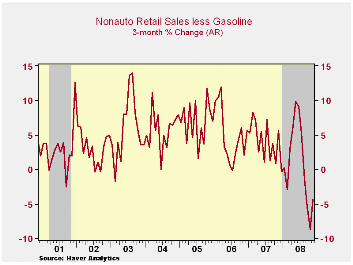
Retail sales less autos and gasoline posted their first m/m increase since July. (It wasn't much of a gain.) They rose 0.3% after declines of roughly 0.7% during each of the prior three months.
Sales at furniture and electronics & appliance stores recouped all of their October drop with a 1.5% gain. However, that still left them down 7.8% y/y. Furniture store sales ticked up 0.2% (-10.9% y/y) after five monthly declines which ranged between 1% and 3% each month. Sales of electronics & appliance stores recovered 2.8% (-4.7% y/y) after a 2.0% October drop.
Apparel store sales ticked up 0.8% (-5.8% y/y) after three monthly declines which ranged between 0.7% and 4.1%. Doing somewhat better were sales at general merchandise stores which rose for the first month in the last five. The 1.2% gain raised them 2.6% from the year ago level.
Folks continued to pare their dining-out budgets. Restaurant & drinking place sales ticked up 0.2% last month, but the y/y gain of 2.8% compares to 5.2% growth last year and 6.0%+ growth during the prior three years. Steady near 10% y/y has been the growth in sales at drinking places while sales growth at both full-service and limited-service restaurants has fallen.
Building materials sales have fallen off a cliff with the downturn in housing. The 1.2% drop (-5.3% y/y) was the fifth decline in the last six.
Sales at nonstore (internet) retailers also have been hit hard. The 1.3% decline last month (-2.7% y/y) was the fifth in a row, a period during which sales have fallen 6.0%.
| November | October | September | Y/Y | 2007 | 2006 | 2005 | |
|---|---|---|---|---|---|---|---|
| Retail Sales & Food Services (%) | -1.8 | -2.9 | -1.6 | -7.4 | 4.1 | 5.8 | 6.4 |
| Excluding Autos | -1.6 | -2.4 | -0.7 | -2.9 | 4.5 | 6.8 | 7.5 |
| Less Gasoline | 0.3 | -0.7 | -0.7 | 0.1 | 4.2 | 6.2 | 6.4 |
by Tom Moeller December 12, 2008
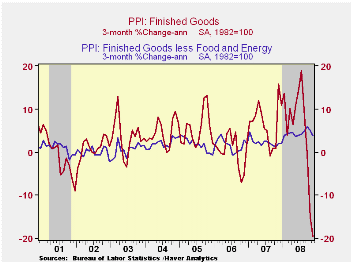
Last month U.S. finished producer prices fell 2.2%, about as they did during October when they were down 2.8%. Finished energy prices (-16.1% y/y) were down about as they were in October, by 11.2%. Gasoline prices led the decline with a one-third drop (-40.1% y/y).
Other oil based prices were down as well as home heating oil
prices
fell by one-quarter (-21.9% y/y). Natural gas prices fell for the
fourth consecutive month but the 1.7% m/m decline left them still up
7.3% y/y. Bucking a steep downtrend residential electric power costs
slipped 0.4% but they were up 6.5% y/y. (All of these energy price
series are not seasonally adjusted.)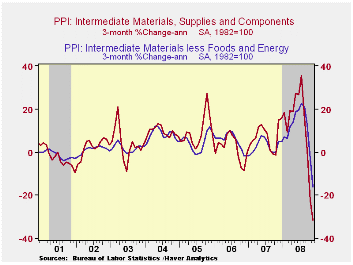
Finished consumer food prices were unchanged after their 0.2% drop during October. Strength in food prices still is evident in a 6.8% y/y gain led by a 18.5% rise in meat prices and a 10.1% rise in bakery product prices. Fresh & dried vegetable prices also were strong, up 12.1% y/y, but fruit prices fell 12.2%.
Less food & energy prices, the increase moderated to
0.1% after
a 0.4% October rise. Consensus expectations were for a for a 0.1%
uptick. The moderation follows four consecutive monthly increases
between 0.4% and 0.6%. The y/y gain in the core PPI of 4.2% was near
the strongest since late-1989. Prices of core finished consumer goods
ticked up 0.1% (4.4% y/y), nearly the strongest since 1989. Durable
consumer goods prices were unchanged (2.4% y/y). Appliance prices
firmed and posted a 4.0% y/y rise following the 1.1% increase during
2007. Core nondurable goods prices also strengthened and rose 5.9% y/y,
the fastest gain since early 1999. Prices for capital equipment also
firmed. Though they ticked up just 0.1% last month, the 3.7% y/y gain
is double the rise during last year and the strongest since 1989.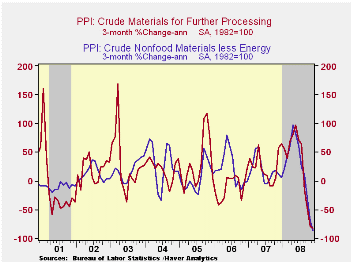
Intermediate goods prices fell 4.3% as energy prices dropped further. Excluding food & energy prices fell for the third consecutive month but the 2.3% m/m fall still left these prices up 6.4% y/y, more than double the increase last year.
The crude materials PPI was down sharply for the fourth straight month and the 12.5% decline about matched the earlier drops. Energy prices led the fall with an 18.7% (-28.8% y/y) drop. Crude food prices also were off 1.2% (-5.2% y/y). Less food & energy crude prices fell 20.4% with the drop in commodity prices.
| Producer Price Index (%) | November | October | Y/Y | 2007 | 2006 | 2005 |
|---|---|---|---|---|---|---|
| Finished Goods | -2.2 | -2.8 | 0.2 | 3.9 | 3.0 | 4.9 |
| Core | 0.1 | 0.4 | 4.2 | 1.9 | 1.5 | 2.4 |
| Intermediate Goods | -4.3 | -3.9 | 2.5 | 4.1 | 6.4 | 8.0 |
| Core | -2.3 | -1.7 | 6.4 | 2.8 | 6.0 | 5.5 |
| Crude Goods | -12.5 | -18.6 | -19.2 | 12.1 | 1.4 | 14.6 |
| Core | -20.4 | -17.0 | -22.2 | 15.6 | 20.8 | 4.9 |
by Robert Brusca December 12, 2008
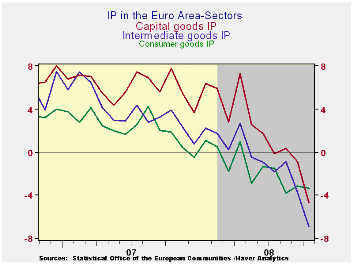
The contribution to growth from IP is weakening sharply. The
decline in IP, one that is an inflation-adjusted reading, is at a
-13.5% rate in Q4. Consumer goods output is the strong sector, oddly
enough, falling at a -3.8% pace early in Q4. Intermediate goods output
is falling at a 19% annual rate in the quarter. Capital goods output is
falling at a 15% annual rate in Q4. The fourth quarter is cropping up
to be extremely weak.
The sequential growth rates from 12-mo to 6-Mos to 3Mos also
show that the annual rate of decline in output is generally getting
worse or staying near its worst growth rates across industries.
The results for the key large countries mirror the overall
findings. Spain whose numbers are simply more volatile that the rest,
shows the smallest quarter to date decline. I suspect that will change
as more numbers roll in. Spain is not doing well. Germany, France and
Italy each show a larger Yr/Yr decline in IP than the EMU-wide average
for the current quarter. For Yr/Yr growth in IP France, Italy and Spain
are worse than the EMU-wide average for MFG output.
The sting of decline is sharp in EMU and it has hit very hard
in the last two months IP has been in sporadic decline in EMU as it had
fallen (m/m) five times in 2007. But through October in 2008 IP already
has fallen in seven of ten months. Moreover the declines in Sept and
Oct have been severe and, of course, back to back. Output has dropped
in five of the past six months. The outlook for the final two months is
for the figures to stay bad or to get worse. No wonder the EU finally
got around to approving a stimulus plan worth about 1.5% of GDP as the
IMF suggested. There is no VAT cut as Germany’s Merkel has been opposed
to that. But the EU may review further stimulus options later.
| E-zone MFG IP | ||||||||||
|---|---|---|---|---|---|---|---|---|---|---|
| Saar except m/m | Mo/Mo | Oct 08 |
Sep 08 |
Oct 08 |
Sep 08 |
Oct 08 |
Sep 08 |
|||
| Ezone Detail | Oct 08 |
Sep 08 |
Aug 08 |
3Mo | 3Mo | 6mo | 6mo | 12mo | 12mo | Q-4 |
| MFG | -1.3% | -1.9% | 0.7% | -9.8% | -6.0% | -9.0% | -5.7% | -5.1% | -2.7% | -13.5% |
| Consumer | 0.0% | -0.7% | -0.5% | -4.8% | -4.8% | -5.3% | -3.5% | -3.3% | -3.1% | -3.8% |
| C-Durables | -1.4% | -2.5% | 0.8% | -11.4% | -10.0% | -13.2% | -7.1% | -8.1% | -6.5% | |
| C-Non-durables | 0.3% | -0.8% | -0.4% | -3.5% | -5.0% | -3.7% | -3.7% | -2.4% | -2.9% | |
| Intermediate | -2.0% | -3.0% | 1.2% | -13.9% | -8.4% | -11.8% | -7.2% | -6.9% | -3.7% | -19.3% |
| Capital | -2.0% | -1.9% | 1.3% | -9.9% | -4.2% | -11.0% | -3.3% | -4.7% | -0.9% | -15.6% |
| Main E-zone Countries and UK IP in MFG | ||||||||||
| Mo/Mo | Oct 08 |
Sep 08 |
Oct 08 |
Sep 08 |
Oct 08 |
Sep 08 |
||||
| MFG Only | Oct 08 |
Sep 08 |
Aug 08 |
3Mo | 3Mo | 6mo | 6mo | 12mo | 12mo | Q-2 Date |
| Germany: | -2.2% | -3.6% | 3.3% | -9.8% | -8.5% | -11.0% | -6.6% | -3.9% | -1.8% | -19.2% |
| France:IPx Construct'n |
-2.7% | -0.8% | -0.5% | -14.7% | 0.0% | -12.3% | -4.9% | -7.2% | -2.3% | -18.3% |
| Italy | -1.1% | -2.9% | 0.1% | -14.6% | -15.2% | -12.9% | -9.8% | -6.8% | -6.5% | -16.7% |
| Spain | 0.3% | 2.8% | -10.1% | -26.1% | 15.3% | -29.4% | 14.1% | -11.2% | -4.7% | -8.7% |
| UK | -1.3% | -1.0% | -0.6% | -10.8% | -7.2% | -8.3% | -6.2% | -4.9% | -3.2% | -12.1% |

Tom Moeller
AuthorMore in Author Profile »Prior to joining Haver Analytics in 2000, Mr. Moeller worked as the Economist at Chancellor Capital Management from 1985 to 1999. There, he developed comprehensive economic forecasts and interpreted economic data for equity and fixed income portfolio managers. Also at Chancellor, Mr. Moeller worked as an equity analyst and was responsible for researching and rating companies in the economically sensitive automobile and housing industries for investment in Chancellor’s equity portfolio. Prior to joining Chancellor, Mr. Moeller was an Economist at Citibank from 1979 to 1984. He also analyzed pricing behavior in the metals industry for the Council on Wage and Price Stability in Washington, D.C. In 1999, Mr. Moeller received the award for most accurate forecast from the Forecasters' Club of New York. From 1990 to 1992 he was President of the New York Association for Business Economists. Mr. Moeller earned an M.B.A. in Finance from Fordham University, where he graduated in 1987. He holds a Bachelor of Arts in Economics from George Washington University.
More Economy in Brief


