 Global| Jan 18 2008
Michigan Consumer Sentiment Highest in Four Months
by:Tom Moeller
|in:Economy in Brief
Summary
For early January, the University of Michigan's consumer sentiment index recovered 6.6% m/m to 80.5, the highest level since October.The increase was only the second in eight months and it beat expectations for a continued decline to [...]
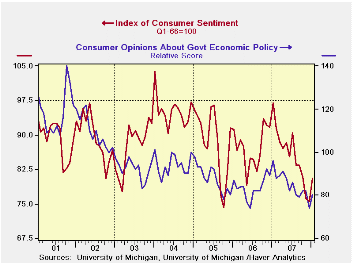
For early January, the University of Michigan's consumer sentiment index recovered 6.6% m/m to 80.5, the highest level since October.The increase was only the second in eight months and it beat expectations for a continued decline to a level of 74.8.
The current conditions index rose 7.8%, following declines in six of the prior seven months, to the highest level since August. Current buying conditions for large household goods rose 12.4% (-7.2% y/y) on the strength of a 2.3% jump in perceptions that now is a good time to buy. The view of current personal finances rose a lesser 2.0% (-18.7% y/y) following two months of decline.
Expected business conditions during the next year rose 5.3%
(-21.1% y/y). A 7.4% improvement in expectations for business
conditions during the next five years lifted the total. The latest
reading is equal to the 4Q average. Expectations for personal finances
rose all of 2.7% (-9.4% y/y), reversed the December decline but was
only the second gain in the last nine months.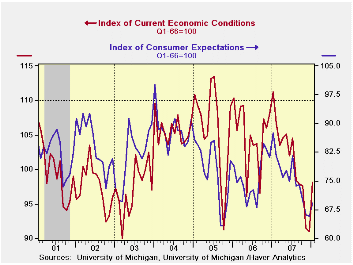
Expectations for inflation during the next twelve months slipped to 4.1%. For the next five to ten years expectations similarly slipped to a 3.4% rise in prices, equal to the expected gain during all of last year.
Opinions about government policy rose 8.1% m/m (-16.7% y/y) and made up most of December's decline.
The University of Michigan survey is not seasonally adjusted.The reading is based on telephone interviews with about 500 households at month-end; the mid-month results are based on about 300 interviews. The summary indexes are in Haver's USECON database, with details in the proprietary UMSCA database.
A Primer on the Mortgage Market and Mortgage Finance from the Federal Reserve Bank of St. Louis is available here.
Evolving Inflation Dynamics from the New Keynesian Philips Curve from the Federal Reserve Bank of Richmond can be found here.
| University of Michigan | Jan (Prelim) | Dec | Nov | Jan y/y | 2006 | 2005 | 2004 |
|---|---|---|---|---|---|---|---|
| Consumer Sentiment | 80.5 | 75.5 | 76.1 | -16.9% | 87.3 | 88.5 | 95.2 |
| Current Conditions | 98.1 | 91.0 | 91.5 | -11.9% | 105.1 | 105.9 | 105.6 |
| Expectations | 69.1 | 65.6 | 66.2 | -21.1% | 75.9 | 77.4 | 88.5 |
by Tom Moeller January 18, 2008
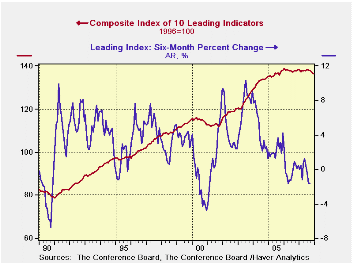
The Conference Board reported that the December composite index of leading economic indicators fell 0.2% after an unrevised 0.4% decline during November. A 0.1% decline had been expected.
For all of last year the leaders fell 0.2% and their six month growth rate, which is calculated as the latest month's reading divided by the average of the prior twelve months, stood at -1.6%. That was equal to the lowest level since 2001.
During the last ten years there has been a 59% correlation
between the y/y change in the leading indicators index and the lagged
change in real GDP.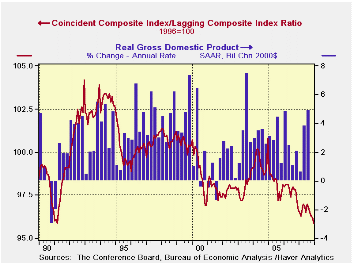
The breadth of one month gain amongst the 10 components of the leading index rose slightly to a still low 40.0%. Over a six month period, the breadth of gain amongst the leaders components was 30%, equal to its lowest level since 2002.
Last month unemployment insurance claims, stock prices, and consumer expectations made the largest contributions to the decline in the overall leading index.
The method of calculating the contribution to the leading
index from the spread between 10 year Treasury securities and the Fed
funds rate has been revised. A negative contribution will now occur
only when the spread inverts rather than when declining as in the past.
More details can be found here.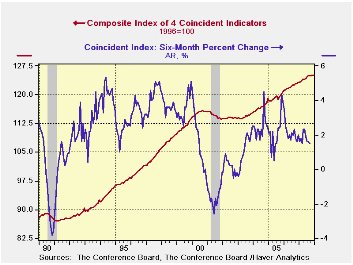
The leading index is based on eight previously reported economic data series. Two series, orders for consumer goods and orders for capital goods, are estimated.
The coincident indicators rose 0.1% after a downwardly revised 0.1% November uptick. Over the last ten years there has been an 86% correlation between the y/y change in the coincident indicators and real GDP growth. Three of the four coincident series components rose very slightly and the gains were offset by a decline in real income.
The lagging index rose 0.4% and continued its steady rise. Last month the gain was due to a longer duration of unemployment. The ratio of coincident to lagging indicators (a measure of economic excess) fell during nine months last year to the lowest level since 1991.
Visit the Conference Board's site for coverage of leading indicator series from around the world.
Signal or Noise? Implications of the Term Premium for Recession Forecasting from the Federal Reserve Bank of New York can be found here.
| Business Cycle Indicators | December | November | Y/Y | 2007 | 2006 | 2005 |
|---|---|---|---|---|---|---|
| Leading | -0.2% | -0.4% | -1.4% | -0.2% | 1.2% | 2.5% |
| Coincident | 0.1% | 0.1% | 1.5% | 1.8% | 2.5% | 2.1% |
| Lagging | 0.4% | 0.2% | 2.3% | 3.0% | 3.0% | 3.5% |
by Robert Brusca January 18, 2008
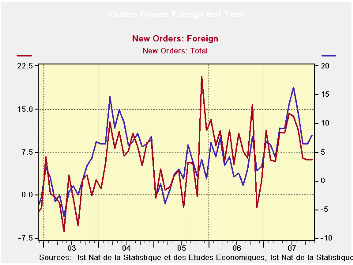
French new industrial orders are lower in two of the past three months. Still, year over year orders retain solid upward momentum. The sequential growth rates, however tell a different story, one of a loss in momentum within the past year. That loss is stronger on the domestic front since we see that foreign orders have stepped down in growth from their Yr/Yr to six month pace but then recovered in the recent three months, when total orders slowed, presumable weighed down by weak domestic orders. Still with that in train Q4 growth in orders is still positive. Total orders are up at a 1.2% pace in the fourth quarter with two months of data in, while foreign orders are up by a much stronger 6.5%.
A survey of small French firms finds that they are reasonably comfortable for now but are concerned about the outlook. France is one of the large EMU economies and is going through a shifting in gears that will impact the EMU growth rate itself.
While today German government officials said there is no need for an EMU-wide stimulus program, the main growth signals from Europe have indicated a slowing. Germans retain confidence that growth will continue despite the challenges and risks. Although there is no way to tell yet how severe the slowing will be in Germany, France, Italy and in the EU’s UK all major EU nations are showing signs of some unevenness in growth.
| French Orders | ||||||
|---|---|---|---|---|---|---|
| Saar except m/m | Nov-07 | Oct-07 | Sep-07 | 3-mo | 6-mo | 12-mo |
| Total | -0.2% | 2.4% | -2.5% | -1.3% | 2.7% | 8.2% |
| Foreign | 1.7% | 2.2% | -2.9% | 3.7% | 2.7% | 6.6% |
by Robert Brusca January 18, 2008
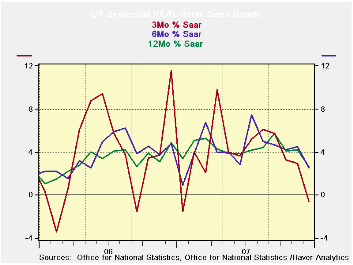
The hit to UK retail sales was severe enough to reverberate in
the exchange markets where sterling suffered a set back in trading
after the retail figures were made public. The chart tells the story
without the benefits of numbers. The pattern clearly shows a loss in
headline momentum and a loss in momentum on all major horizons. Real
excl auto sales echos that pattern.
In numbers retail sales drop by 0.4% (ex autos) in real terms
in December, and that drop is never a good sign. For the full quarter,
however, real retail sales ex autos continue to grow at a pace of 1.9%.
But the slip in the three month growth rate is a negative indicator for
momentum and the period ahead. Food sales were up in December with
nonfood spending weak. UK indicators have been touch and go in recent
months, This one pushes the BOE closer to being truly concerned about
growth and may be enough to get a rate cut from it. But since inflation
data are not cooperative and the EMU region is slowing but holding
policy pat, it is not yet clear if the UK will follow the US lead to
lower rates or to be stoic and stay with continental Europe. The UK
economy seems to be on the cusp.
| UK Real and Nominal Retail Sales | |||||||
|---|---|---|---|---|---|---|---|
| Nominal | Dec-07 | Nov-07 | Oct-07 | 3-Mo | 6-Mo | 12-Mo | Year Ago |
| Total Retail | -0.6% | 0.4% | 0.0% | -0.9% | 0.5% | 1.7% | 4.8% |
| Food Beverages & Tobacco | 0.4% | 0.5% | 0.1% | 4.2% | 5.4% | 3.2% | 5.0% |
| Clothing footwear | 0.0% | -0.7% | -0.9% | -6.2% | -0.1% | -0.5% | 8.1% |
| Real | |||||||
| Retail excl auto | -0.4% | 0.4% | -0.1% | -0.6% | 2.5% | 2.7% | 4.9% |

Tom Moeller
AuthorMore in Author Profile »Prior to joining Haver Analytics in 2000, Mr. Moeller worked as the Economist at Chancellor Capital Management from 1985 to 1999. There, he developed comprehensive economic forecasts and interpreted economic data for equity and fixed income portfolio managers. Also at Chancellor, Mr. Moeller worked as an equity analyst and was responsible for researching and rating companies in the economically sensitive automobile and housing industries for investment in Chancellor’s equity portfolio. Prior to joining Chancellor, Mr. Moeller was an Economist at Citibank from 1979 to 1984. He also analyzed pricing behavior in the metals industry for the Council on Wage and Price Stability in Washington, D.C. In 1999, Mr. Moeller received the award for most accurate forecast from the Forecasters' Club of New York. From 1990 to 1992 he was President of the New York Association for Business Economists. Mr. Moeller earned an M.B.A. in Finance from Fordham University, where he graduated in 1987. He holds a Bachelor of Arts in Economics from George Washington University.
More Economy in Brief


