 Global| Feb 15 2008
Michigan Consumer Sentiment Dropped Hard
by:Tom Moeller
|in:Economy in Brief
Summary
During early February, the University of Michigan's consumer sentiment index fell a hard 11.2% from the January average to a level of 69.6. A reading of 76 had been expected. It was the largest m/m decline since 2005 and it was to the [...]
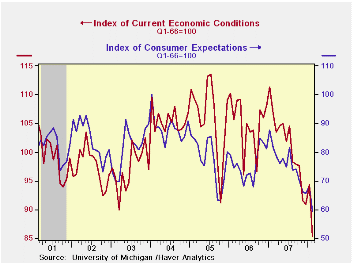
During early February, the University of Michigan's consumer sentiment index fell a hard 11.2% from the January average to a level of 69.6. A reading of 76 had been expected. It was the largest m/m decline since 2005 and it was to the lowest level since early 1992.
The index of expected business conditions during the next year
fell the hardest with a 12.8% m/m decline to its lowest level since the
recession of 1990. Expectations for business conditions during the next
five years fell 10.2% while expectations for personal finances fell
6.9%.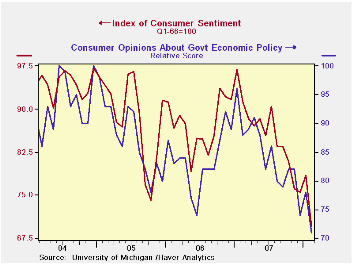
The current conditions index more than reversed the January rise with a 9.5% drop. Current conditions for buying large household goods fell out of bed with a 15.1% plunge to the lowest level since 1992. The view of current personal finances fell slightly.
Expectations for inflation during the next twelve months were unchanged at 4.0% and for the next five to ten years expectations ticked up to 3.5%.
Opinions about government policy fell sharply. The 9.0% m/m decline was one of the largest and dropped this measure of opinions to the lowest level since 1993.
The University of Michigan survey is not seasonally adjusted.The reading is based on telephone interviews with about 500 households at month-end; the mid-month results are based on about 300 interviews. The summary indexes are in Haver's USECON database, with details in the proprietary UMSCA database.
| University of Michigan | Feb (Prelim. | Jan | Dec | Feb y/y | 2007 | 2006 | 2005 |
|---|---|---|---|---|---|---|---|
| Consumer Sentiment | 69.6 | 78.4 | 75.5 | -23.8% | 85.6 | 87.3 | 88.5 |
| Current Conditions | 85.4 | 94.4 | 91.0 | -20.0% | 101.2 | 105.1 | 105.9 |
| Expectations | 59.4 | 68.1 | 65.6 | -27.1% | 75.6 | 75.9 | 77.4 |
by Tom Moeller February 15, 2008
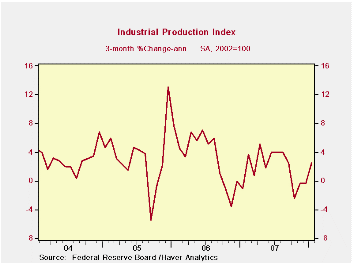
Industrial production ticked 0.1% higher last month following an upwardly revised 0.1% rise during December. The latest increase was as expected.
Factory output also rose 0.1% after an upwardly revised 0.2% December increase. The m/m gains have picked up a bit since scattered declines last Summer. As a result the three month growth in output rose to 2.1% (AR) from a low of -4.1% in September. Some of that improvement owes to the high tech sector. Less high tech factory output was unchanged in January and three month growth was 1.1%.
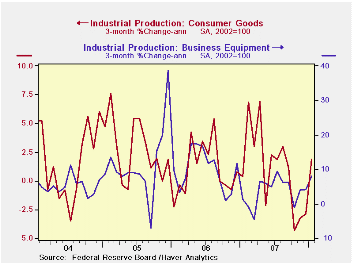
Production of computers & electronics surged 1.4% (14.4% y/y) after a very much upwardly revised 1.0% December gain. Output of furniture & appliances fell 2.1% and three month dropped to -14.3%. Chemical product output also fell by 0.4%. There was scattered improvement elsewhere. Output of automotive products dropped 1.2% but rose 5.3% on a three month basis. Apparel product output fell 0.1% and three month growth rose to 2.6%.
Output of construction supplies fell again, last month by 1.1% and three month remained negative at -2.6%.
Output of business equipment rose 0.4% with three month growth up to 8.0%. Output of industrial equipment fell 0.4% but three month improved to 2.5%.
Capacity utilization was unchanged for the third month at 81.5%. Utilization in the factory sector slipped a hair to 79.7% from 78.8% where it had been for three months. That ias down from an 80.1% average last year.
| INDUSTRIAL PRODUCTION (SA) | January | December | Y/Y | 2007 | 2006 | 2005 |
|---|---|---|---|---|---|---|
| Total | 0.1% | 0.1% | 2.2% | 1.9% | 4.0% | 3.2% |
| Manufacturing | 0.1% | 0.2% | 2.0% | 1.9% | 4.7% | 3.9% |
by Tom Moeller February 15, 2008
Overall import prices during January rose a strong 1.7%. The rise, which was three times expectations, followed the December respite when temporarily lower oil prices produced a revised 0.2% decline initially reported as no change. Consensus expectations had been for a 0.5% rise in January prices.
Petroleum prices jumped 5.5% after a 1.9% decline to close out last year. Crude petroleum prices surged 4.5% (69.7% y/y) after December's 1.3% decline. That strength was exceeded by a 10.2% (73.7% y/y) jump in fuel oil prices and an 8.1% (44.2% y/y) rise in other petroleum product prices.
Less petroleum, import prices rose 0.6% after a 0.3% December increase. The latest m/m rise was near the strongest since November 2006.
During
the last ten years there has been a 66% (negative) correlation between
the nominal trade-weighted exchange value of the US dollar vs. major
currencies and the y/y change in non oil import prices. The correlation
is a reduced 47% against a broader basket of currencies.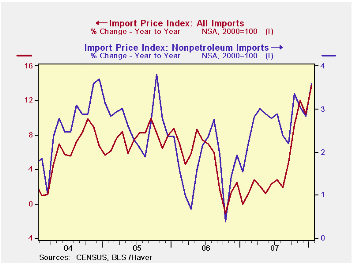
Prices for industrial supplies & materials excluding petroleum surged 2.2% (10.1% y/y) led by strength in paper prices and a 9.7% (21.1% y/y) blowout in chemical prices. The detailed import price series can be found in the Haver USINT database.
Capital goods import prices fell 0.2% (+0.5% y/y) as prices of computers, peripheral and semiconductors declined again, last month by 1.4% (-5.4% y/y). Less the high tech sector, January capital goods prices rose a modest 0.2% (3.0% y/y) though that rate of gain has accelerated from 2.7% growth last year and 1.4% during 2006.
Prices for imports of nonauto consumer goods rose 0.3% (1.6% y/y) and that y/y rise in prices has been stable since early last year. Apparel prices rose 0.3% (1.9% y/y). These prices had been unchanged or declining through 2004 to 2006. Prices for household goods rose 0.4% (1.5% y/y), a y/y change that has been fairly stable.
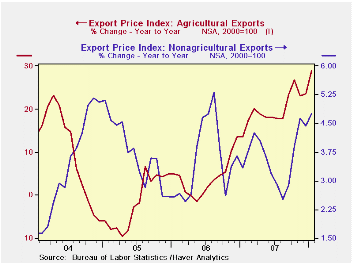
Overall export prices surged 1.2% due to a 5.0% (28.9% y/y) rise in agricultural prices. Prices for nonagricultural goods also rose a relatively strong 0.8% (4.8% y/y).
Some Simple Tests of the Globalization and Inflation Hypothesis from the Federal Reserve Board can be found here.
| Import/Export Prices (NSA) | January | December | Y/Y | 2007 | 2006 | 2005 |
|---|---|---|---|---|---|---|
| Import - All Commodities | 1.7% | -0.2% | 13.7% | 4.2% | 4.9% | 7.5% |
| Petroleum | 5.5% | -1.9% | 66.9% | 11.5% | 20.6% | 37.6% |
| Non-petroleum | 0.6% | 0.3% | 3.6% | 2.7% | 1.7% | 2.7% |
| Export- All Commodities | 1.2% | 0.4% | 6.7% | 4.9% | 3.6% | 3.2% |
by Robert Brusca February 15, 2008
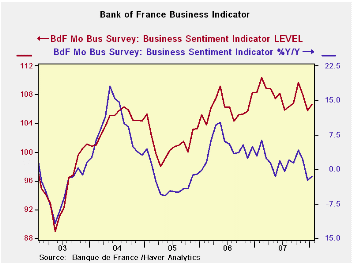
The Bank of France monthly business survey for January 2008
shows that production has held up but that there is a clear gnawing
away at past trends. The chart at the top shows that the Biz indicators
have been fairly flat recently but viewed as a percentage from a Year
ago there is clear degradation in the index’s momentum. The sentiment
index itself now sits just below the middle of this two year range in
the 45th percentile. The production outlook is near the top third of
its range in the 64th percentile. Order book reading are in the 60th
percentile and foreign order books have slipped to their 35th
percentile. New orders at 56.9% stand above their midpoint at the
56.9th percentile.
Despite some slippage in the year over year reading most of
the index levels for January are still very near their respective
12-month averages. The Bank of France views the index as a positive in
the outlook for growth in Q1. However the index is clearly losing its
momentum.
| Bank of France Monthly INDUSTRY Survey: SUMMARY | ||||||
|---|---|---|---|---|---|---|
| 12 MO | Since Jan-87 | 2Yr Percentile | ||||
| Jan-08 | Dec-07 | Nov-07 | AVERAGE | Average | rank/range | |
| Production-latest mo | ||||||
| Total Industry | 19.07 | -4.08 | 3.83 | 8 | 7 | 98.0% |
| Production Outlook | ||||||
| Total Industry | 16.57 | 21.79 | 15.87 | 16 | 15 | 64.1% |
| Demand | ||||||
| Overall order books | 25.35 | 25.66 | 27.43 | 27 | 4 | 60.1% |
| Foreign Orders | 10.97 | 8.95 | 8.59 | 11 | 9 | 35.0% |
| New Orders | ||||||
| Total Industry | 12.53 | 9.55 | 7.9 | 11 | 9 | 56.9% |
| Stocks: Finished Goods | ||||||
| Total Industry | -1.88 | -4.77 | -2.87 | -3 | -2 | 63.4% |
| Capacity Utilization | 83.44 | 80.83 | 83.69 | 84 | 83 | 62.1% |
| Hiring | ||||||
| Latest Mo | 2.44 | -1.55 | 1.01 | 0 | -1 | 98.0% |
| Outlook | -1.7 | -0.81 | -0.89 | -2 | -4 | 74.4% |
| Industry Sentiment Index | 106.62 | 105.8 | 108.01 | 108 | 107 | 45.6% |
by Robert Brusca February 15, 2008
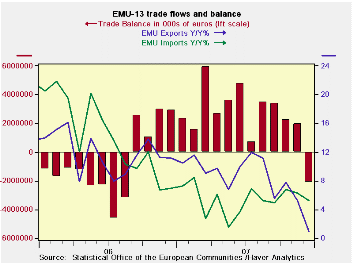
EMU import growth is slowing but export growth is slowing
faster. As a result EMU has developed its first trade deficit in 16
months. Germany and Finland the two EMU countries with the lowest
inflation rates in the last 10 years continue to post surpluses. As the
lowest inflation countries in this common currency area they are more
price competitive than other EMU nations.
On a seasonally adjusted basis, eight of the 13 countries
belonging to the euro area in December registered a trade deficit, led
by sizeable deficits in The Netherlands (-E8.0 billion) and Spain
(-E5.0 billion). Among the larger EMU countries, Italy (-E2.4 billion)
and France (-E0.6 billion) posted deficits. Red ink was also chalked up
on the trade account by were also posted by Belgium (-E1.8 billion) and
Greece (-E1.5 billion).
The EMU surplus with the US is now shrinking slightly and is
abut E8bln lower than it was a year ago. Exports to the US are down
Yr/Yr and imports are up. It is looking like the weak dollar/strong
euro are having an impact.
Like the US, EMU has a huge deficit with China that rose to
E101bln last year from E82.6bln in 2006, as imports from China’s
spurted by 18%. This is also a reminder that while corporations
continue to be very up beat on China growth, if the US and Europe
slowdown China’s exports and growth overall will slow as well. China
may have a slug of domestic infrastructure building in progress, but it
remains highly dependent on trade.
| Euro Area: 13-Trade trends for goods | ||||||
|---|---|---|---|---|---|---|
| m/m% | % Saar | |||||
| Dec-07 | Nov-07 | 3-Mo | 6-Mo | 12-Mo | 12-Mo Ago | |
| Balance* | €€ (2,105) | €€ 1,965 | €€ 703 | €€ 1,603 | €€ 2,550 | €€ (685) |
| Exports | ||||||
| All Exports | -2.5% | -0.7% | -8.3% | -3.2% | 1.0% | 11.2% |
| Food and Drinks | -1.8% | 0.6% | 0.3% | 7.1% | 5.1% | 12.0% |
| Raw Materials | -1.7% | -2.1% | -11.7% | -9.7% | 1.7% | 13.9% |
| Other | -2.6% | -0.8% | -8.8% | -3.6% | 0.7% | 11.0% |
| MFG | -4.2% | -0.4% | -17.1% | -7.1% | -2.3% | 11.3% |
| Imports | ||||||
| All Imports | 0.7% | -0.5% | 9.2% | 8.2% | 5.2% | 7.0% |
| Food and Drinks | -4.2% | -2.2% | -27.1% | 8.6% | 9.0% | 5.2% |
| Raw Materials | -0.3% | -2.1% | -4.9% | -4.9% | -1.8% | 23.6% |
| Other | 1.0% | -0.3% | 12.8% | 8.9% | 5.4% | 6.3% |
| MFG | -2.4% | -2.7% | -20.9% | -9.2% | -4.2% | 9.9% |
| *Eur mlns; mo or period average | ||||||

Tom Moeller
AuthorMore in Author Profile »Prior to joining Haver Analytics in 2000, Mr. Moeller worked as the Economist at Chancellor Capital Management from 1985 to 1999. There, he developed comprehensive economic forecasts and interpreted economic data for equity and fixed income portfolio managers. Also at Chancellor, Mr. Moeller worked as an equity analyst and was responsible for researching and rating companies in the economically sensitive automobile and housing industries for investment in Chancellor’s equity portfolio. Prior to joining Chancellor, Mr. Moeller was an Economist at Citibank from 1979 to 1984. He also analyzed pricing behavior in the metals industry for the Council on Wage and Price Stability in Washington, D.C. In 1999, Mr. Moeller received the award for most accurate forecast from the Forecasters' Club of New York. From 1990 to 1992 he was President of the New York Association for Business Economists. Mr. Moeller earned an M.B.A. in Finance from Fordham University, where he graduated in 1987. He holds a Bachelor of Arts in Economics from George Washington University.
More Economy in Brief


