 Global| Apr 02 2009
March U.S. Light Vehicle Sales Increase From 27-Year low
by:Tom Moeller
|in:Economy in Brief
Summary
Perhaps replacement demand was a factor when it came to light vehicle sales last month. Possibly, it was deep price discounts. Or was this the beginning of a bona fide uptrend? For whatever reason, U.S. unit sales of light vehicles [...]

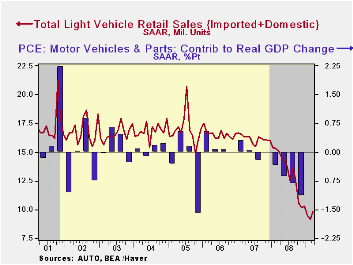
Perhaps replacement demand was a factor when it came to light vehicle sales last month. Possibly, it was deep price discounts. Or was this the beginning of a bona fide uptrend? For whatever reason, U.S. unit sales of light vehicles increased 7.8% from February to 9.83M units (SAAR). The result was an upside surprise versus expectations for a 9.2M sales rate. Though sales were up slightly from February as well as from January, the latest figure still was near the lowest since 1982 according to the Autodata Corporation and Ward's Automotive News. (Seasonal adjustment of the figures is provided by the U.S. Bureau of Economic Analysis).
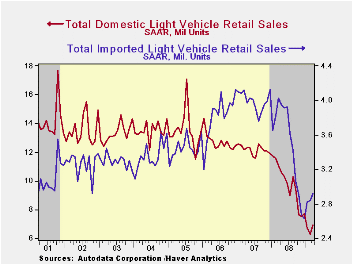
Sales of domestically-made light vehicles registered an impressive 10.1% month-to-month increase from February to 6.92M units. That was enough to fully recover the 6.8% February drop. Sales of domestically made light trucks recovered more than half of their February decline with an 8.7% increase to 3.70M units. While impressive, that rise was outpaced by an 11.7% increase in auto sales to 3.23M units, their highest level since December.
Steps toward a New Financial Regulatory Architecture is yesterday's speech by Cleveland Fed President & CEO Sandra Pianalto and it can be found here.
| Light Vehicle Sales (SAAR, Mil. Units) | March | February | January | March Y/Y | 2008 | 2007 | 2006 |
|---|---|---|---|---|---|---|---|
| Total | 9.83 | 9.12 | 9.57 | -34.9% | 13.17 | 16.16 | 16.54 |
| Autos | 5.05 | 4.63 | 4.60 | -32.6 | 6.71 | 7.58 | 7.77 |
| Domestic | 3.23 | 2.89 | 2.84 | -33.9 | 4.42 | 5.07 | 5.31 |
| Imported | 1.83 | 1.74 | 1.76 | -30.1 | 2.29 | 2.52 | 2.45 |
| Light Trucks | 4.78 | 4.50 | 4.97 | -37.1 | 6.47 | 8.60 | 8.78 |
| Domestic | 3.70 | 3.40 | 3.91 | -40.3 | 5.29 | 7.10 | 7.42 |
| Imported | 1.09 | 1.10 | 1.06 | -23.0 | 1.18 | 1.47 | 1.37 |
Tom Moeller
AuthorMore in Author Profile »Prior to joining Haver Analytics in 2000, Mr. Moeller worked as the Economist at Chancellor Capital Management from 1985 to 1999. There, he developed comprehensive economic forecasts and interpreted economic data for equity and fixed income portfolio managers. Also at Chancellor, Mr. Moeller worked as an equity analyst and was responsible for researching and rating companies in the economically sensitive automobile and housing industries for investment in Chancellor’s equity portfolio. Prior to joining Chancellor, Mr. Moeller was an Economist at Citibank from 1979 to 1984. He also analyzed pricing behavior in the metals industry for the Council on Wage and Price Stability in Washington, D.C. In 1999, Mr. Moeller received the award for most accurate forecast from the Forecasters' Club of New York. From 1990 to 1992 he was President of the New York Association for Business Economists. Mr. Moeller earned an M.B.A. in Finance from Fordham University, where he graduated in 1987. He holds a Bachelor of Arts in Economics from George Washington University.
More Economy in Brief
 Global| Feb 05 2026
Charts of the Week: Balanced Policy, Resilient Data and AI Narratives
by:Andrew Cates


