 Global| Apr 02 2009
March U.S. Light Vehicle Sales Increase From 27-Year low
by:Tom Moeller
|in:Economy in Brief
Summary
Perhaps replacement demand was a factor when it came to light vehicle sales last month. Possibly, it was deep price discounts. Or was this the beginning of a bona fide uptrend? For whatever reason, U.S. unit sales of light vehicles [...]
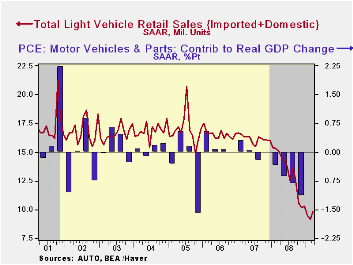
Perhaps replacement demand was a factor when it came to light vehicle sales last month. Possibly, it was deep price discounts. Or was this the beginning of a bona fide uptrend? For whatever reason, U.S. unit sales of light vehicles increased 7.8% from February to 9.83M units (SAAR). The result was an upside surprise versus expectations for a 9.2M sales rate. Though sales were up slightly from February as well as from January, the latest figure still was near the lowest since 1982 according to the Autodata Corporation and Ward's Automotive News. (Seasonal adjustment of the figures is provided by the U.S. Bureau of Economic Analysis).
Sales of domestically-made light vehicles
registered an impressive 10.1% month-to-month increase from February to
6.92M units. That was enough to fully recover the 6.8% February drop.
Sales of domestically made light trucks recovered more than half of
their February decline with an 8.7% increase to 3.70M units. While
impressive, that rise was outpaced by an 11.7% increase in auto sales
to 3.23M units, their highest level since December.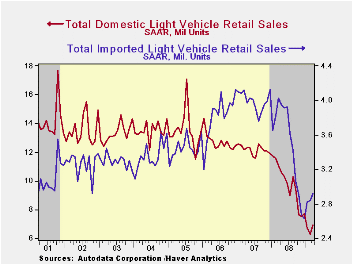
Imported light vehicle sales rose a more modest 2.8% m/m last month but that followed a slight February increase. Still outpacing domestics, the year-to-year decline in sales of imported vehicles amounted to just 27.6%. That was far less than the decline for U.S. made vehicles. Sales of imported autos rose an impressive 5.1% during March to their highest level since last October. Light truck sales fell a modest 0.8% after four months of increase.
Overall, import's share of the U.S. light vehicle market totaled 29.6% following the record 31.1% during February. That latest figures were up nearly five percentage points from the 2008 average. (Imported vehicles are those produced outside the United States.) Imports' share of the U.S. car market totaled 36.2% while the share of the light truck market was 22.7%.
The U.S. vehicle sales figures can be found in Haver's USECON database.
Steps toward a New Financial Regulatory Architecture is yesterday's speech by Cleveland Fed President & CEO Sandra Pianalto and it can be found here.
| Light Vehicle Sales (SAAR, Mil. Units) | March | February | January | March Y/Y | 2008 | 2007 | 2006 |
|---|---|---|---|---|---|---|---|
| Total | 9.83 | 9.12 | 9.57 | -34.9% | 13.17 | 16.16 | 16.54 |
| Autos | 5.05 | 4.63 | 4.60 | -32.6 | 6.71 | 7.58 | 7.77 |
| Domestic | 3.23 | 2.89 | 2.84 | -33.9 | 4.42 | 5.07 | 5.31 |
| Imported | 1.83 | 1.74 | 1.76 | -30.1 | 2.29 | 2.52 | 2.45 |
| Light Trucks | 4.78 | 4.50 | 4.97 | -37.1 | 6.47 | 8.60 | 8.78 |
| Domestic | 3.70 | 3.40 | 3.91 | -40.3 | 5.29 | 7.10 | 7.42 |
| Imported | 1.09 | 1.10 | 1.06 | -23.0 | 1.18 | 1.47 | 1.37 |
by Tom Moeller April 2, 2009
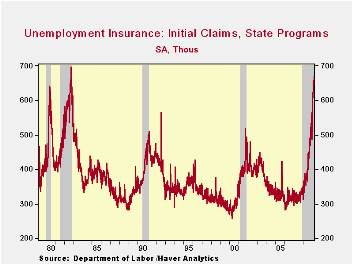
There has been no letup in the U.S. labor market's distress. Initial claims for unemployment insurance rose last week to the highest level since the sharp recession of 1982. The figure of 669,000 was up from an unrevised 657,000 during the prior week and it surpassed Consensus expectations for 650,000 claims.
The Labor Department indicated that the largest increases in initial claims for the week ending March 21 were in California (+6,720), Missouri (+2,942), Kansas (+2,018), Oklahoma (+1,406), and Iowa (+1,134), while the largest decreases were in Texas (-4,822), New York (-3,172), Tennessee (-2,707), Illinois (-1,485), and Virginia (-1,407).
Continuing claims for unemployment insurance reached yet
another record high of 5,728,000 and remained nearly double
that of last March. The series dates back to 1966. The
four-week average of continuing claims also rose to another record of
5,496,500. Continuing claims provide some indication of workers'
ability to find employment and they lag the initial claims figures by
one week.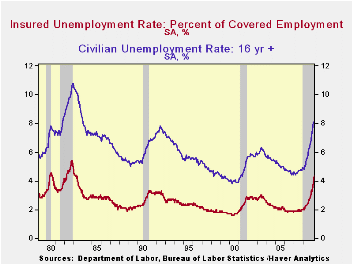
Though the latest level of continuing claims was a record, the labor force has grown as well, by nearly 30% over the last twenty years. Therefore, the insured rate of unemployment is not at a record high. It rose to 4.3% which was the highest since 1983. During the last ten years there has been a 93% correlation between the level of the insured unemployment rate and the overall rate of unemployment published by the Bureau of Labor Statistics.
The 4.3% insured unemployment rate by far understates labor market distress in some states. The highest insured unemployment rates in the week ending March 14 were in Michigan (8.1 percent), Oregon (7.7), Rhode Island (7.3), Idaho (7.2), Pennsylvania (7.0), Wisconsin (6.8), Nevada (6.3), Montana (6.1), Alaska (6.0), and Vermont (6.0).
The unemployment insurance claim data is available in Haver's WEEKLY database.
Fed Confronts Financial Crisis by Expanding Its Role as Lender of Last Resort from the Federal Reserve Bank of Dallas can be found here.
A Framework for Analyzing Bank Lending is Tuesday's speech by Fed Governor Elizabeth A. Duke and it is available here.
| Unemployment Insurance (000s) | 03/28/09 | 03/21/09 | 03/13/09 | Y/Y | 2008 | 2007 | 2006 |
|---|---|---|---|---|---|---|---|
| Initial Claims | 669 | 657 | 644 | 72.0% | 420 | 321 | 313 |
| Continuing Claims | -- | 5,728 | 5,567 | 95.8% | 3,342 | 2,552 | 2,459 |
by Tom Moeller April 2, 2009
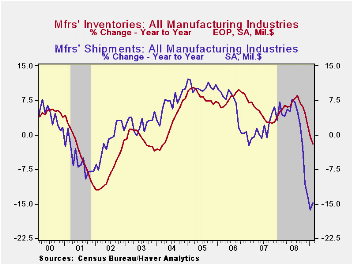
The manufacturing sector continued to shed inventories during February at a record rate. A 1.2% cutback followed declines of 1.1% and 1.9% during the prior two months. Moreover, that amounted to a 15.4% annualized rate of stockpile decumulation which was a record for a three-month period. The series dates back to 1958. Of course, that accelerated rate stems somewhat from the 72.0% rate of decline in petroleum inventories, due mostly to lower prices. Nevertheless, excluding oil factory inventories fell roughly 1.0% during the last two months. The 10.6% three-month rate of decumulation was only slightly exceeded in 2001.
The three-month rates of inventory destocking in several
industries have been more than notable. Inventories of electrical
equipment & appliances have fallen at a 27.6% rate while
textile product inventories were down at a 36.6% clip. Steep production
cutbacks pulled furniture inventories down at a 21.7% rate since
November while inventories of primary metals fell at a 32.9% pace.
Lesser rates of decline were registered in the machinery industry
(-4.7%) and by computers & electronic products (2.3%).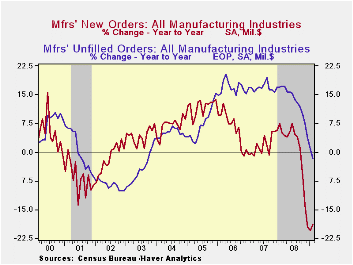
Factory shipments continued lower during February prompting the continued lowering of inventory levels. Shipments fell a modest 0.1% but even excluding oil and its lower prices shipments fell at 17.8% rate over the last three months. That was led by a 67.1% rate of decline in automobile shipments. Electrical equipment shipments also fell hard at a 22.8% rate and computers were off at a 20.8% rate. In the nondurable goods area, apparel shipments fell at a 16.4% rate, about the same as for paper products.
Total factory orders recovered during February roughly half of the sharp January drop but over three months the decline was at a 24% annual rate. That was led by a 26% rate of decline in computer orders while motor vehicle orders fell at a 25.1% rate and electrical equipment orders fell at a 13.2% rate.As for order backlogs, they are easing substantially. Sharp declines during the last three months have been at a record 18.1% annual rate.
The Manufacturers' Shipments, Inventories and Orders (MSIO) data is available in Haver's USECON database.
What do we know and not know about potential output? from the Federal Reserve Bank of San Francisco can be found here.
| Factory Survey (NAICS, %) | February | January | Y/Y | 2008 | 2007 | 2006 |
|---|---|---|---|---|---|---|
| Inventories | -1.2 | -1.1 | -2.0 | 2.1 | 3.7 | 8.2 |
| Excluding Transportation | -1.4 | -1.2 | -4.8 | -0.6 | 2.7 | 7.9 |
| New Orders | 1.8 | -3.5 | -18.8 | 0.1 | 1.9 | 6.2 |
| Excluding Transportation | 1.6 | -2.4 | -15.1 | 3.1 | 1.2 | 7.4 |
| Shipments | -0.1 | -2.6 | -14.8 | 1.7 | 1.2 | 5.9 |
| Excluding Transportation | -0.1 | -2.4 | -14.0 | 3.7 | 1.5 | 6.7 |
| Unfilled Orders | -1.4 | -2.0 | -1.7 | 3.5 | 17.1 | 15.3 |
| Excluding Transportation | -1.5 | -2.8 | -6.0 | -1.0 | 8.2 | 16.0 |
by Robert Brusca April 2, 2009
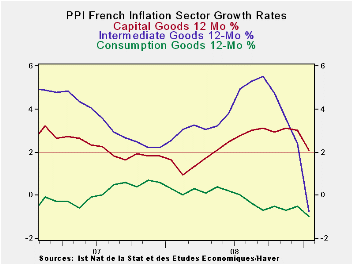
Headline and sector inflation rates for France are showing
consistent declines. The core is also on a decelerating trend.
Excluding construction the PPI is falling over rapidly. Anyway you cut
the inflation signals at the PPI level France is showing weakness in
prices.
Still, at the Summit in London, French and German leaders are
focused on patching up the global regulatory system. The persisting
downward pressure on prices suggests that weak growth is still public
enemy number one. The ECB got on board today with a rate cut, but once
again it was about half the magnitude of the cut that the market
expected. Markets retreated after early day strong advances when they
saw the meager cut. Markets regained some ground on the Trichet remark
that there could be more cuts. Markets are playing attention to
everything.
European nations are better protected from bad times compared
to the US as evidenced by their higher continuing rates of unemployment
and more generous social welfare programs.
But the recent backtracking in the Baltic Dry index and
continuing sharp downward pressure on inflation of all sorts in France
are harsh reminders that the recession is still with us and is still
virulent. France was one of the few EMU countries in which the Markit
Manufacturing PMI rose in March. Even so in the EU-Commission scheme of
things France’s industrial sector slipped in March, consumer confidence
stayed at a cycle low, the services sector was on a cycle low and
overall sentiment continued to slip. Weakening price trend are just
another way to underscore this sort of very broad weakness. It is hard
to look at the current needs of the global economy and to square it
with some of the policy work being done in international forums and by
central banks. Being mindful of fiscal discipline is good and wary of
setting of inflation too, but there is a time and place for those
worries and this time and place seem inappropriate for them.
Still European stock markets are hopeful of some sort of turn
in the economy and they are improving. That fits the policy tack of the
European policymakers which is to not worry about growth because enough
has been done. The ECB wants to turn attention to being mindful of
launching irascible inflation trends by not overdoing it. The mixed
signals of the times offer justification for just about anything. Only
time will tell if an opportunity was missed or a hand overplayed.
| France PPI | |||||||
|---|---|---|---|---|---|---|---|
| m/m | Saar | ||||||
| France | Feb-09 | Jan-09 | Dec-08 | 3-Mo | 6-Mo | Yr/Yr | Y/Y Yr Ago |
| Total | -0.6% | -2.6% | -1.1% | -15.6% | -- | -- | -- |
| Consumer | #N/A | -0.6% | 0.0% | -2.4% | -1.6% | -1.0% | 0.3% |
| Intermediate | #N/A | -2.7% | -0.7% | -16.6% | -8.7% | -0.8% | 2.5% |
| Investment | #N/A | -0.6% | -0.1% | -1.8% | 0.4% | 2.1% | 1.6% |
| PPI excl Food and Energy | #N/A | -1.5% | -0.3% | -8.6% | -4.4% | 0.1% | 1.7% |
| HIPP excl Constructions | #N/A | -2.2% | -1.2% | -18.9% | -13.0% | -2.9% | 5.4% |
| Shaded growth rates lag by one -month | |||||||

Tom Moeller
AuthorMore in Author Profile »Prior to joining Haver Analytics in 2000, Mr. Moeller worked as the Economist at Chancellor Capital Management from 1985 to 1999. There, he developed comprehensive economic forecasts and interpreted economic data for equity and fixed income portfolio managers. Also at Chancellor, Mr. Moeller worked as an equity analyst and was responsible for researching and rating companies in the economically sensitive automobile and housing industries for investment in Chancellor’s equity portfolio. Prior to joining Chancellor, Mr. Moeller was an Economist at Citibank from 1979 to 1984. He also analyzed pricing behavior in the metals industry for the Council on Wage and Price Stability in Washington, D.C. In 1999, Mr. Moeller received the award for most accurate forecast from the Forecasters' Club of New York. From 1990 to 1992 he was President of the New York Association for Business Economists. Mr. Moeller earned an M.B.A. in Finance from Fordham University, where he graduated in 1987. He holds a Bachelor of Arts in Economics from George Washington University.
More Economy in Brief


