 Global| Jul 22 2005
MAPI Business Outlook Survey Down in 2Q to the Lowest in Two Years
by:Tom Moeller
|in:Economy in Brief
Summary
The 2Q'05 Composite Business Index published by the Manufacturers' Alliance/MAPI fell to 68 from 71 the prior quarter. The latest level is the lowest level since 3Q'03. During the last ten years there has been a 66% correlation [...]
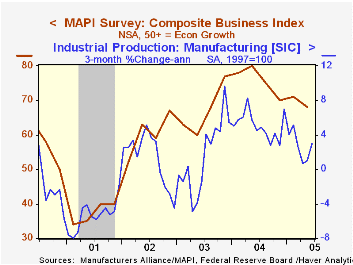
The 2Q'05 Composite Business Index published by the Manufacturers' Alliance/MAPI fell to 68 from 71 the prior quarter. The latest level is the lowest level since 3Q'03.
During the last ten years there has been a 66% correlation between the Composite Index Level and quarterly growth in US factory sector output.
The current orders index continued a slide begun one year ago. While the index level of 86 is down from it's peak of 93, the figures compare favorably to the lows around 30 during 2001.
The export orders index for 2Q slipped to 86 from the record level in 1Q of 90. Again, the figures remain elevated versus the average of 37 during 2001. During the last ten years there has been a 73% correlation between the export orders index and the y/y change in real US exports.
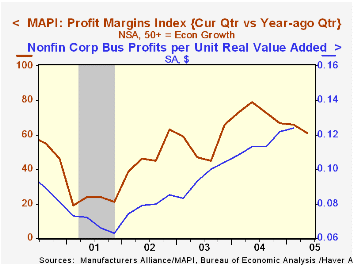
The profit margins index likewise moved lower to the lowest level since 3Q'03.Conversely, capital spending intentions for the coming year moved higher to the highest level since 4Q'03 and during the last ten years there has been a 74% correlation between the capital spending index a y/y growth in business investment in equipment & software.
For the latest US Business Outlook from the MAPI click here.
Future Oil from the Federal Reserve Bank of St. Louis can be found here.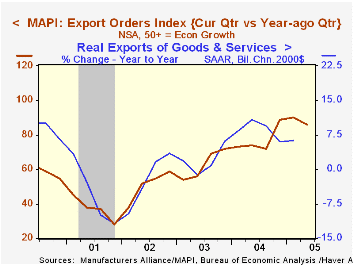
| Manufacturers' Alliance/MAPI Survey | 2Q'05 | 1Q'05 | 2Q'04 | 2004 | 2003 | 2002 |
|---|---|---|---|---|---|---|
| Composite Business Index | 68 | 71 | 80 | 76 | 67 | 60 |
by Carol Stone July 22, 2005
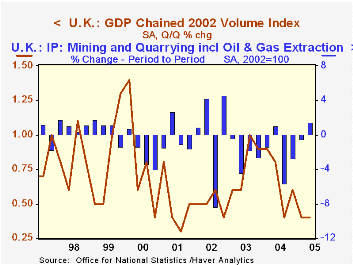
UK GDP grew 0.4% in Q2, according to Office of National Statistics "Preliminary Estimate", the same as in Q1. This early estimate is compiled from industrial production and other industry data. It shows that manufacturing lost 0.7% on the quarter, a somewhat smaller decline than in Q1; the year-on-year performance in manufacturing saw shrinkage of 1.7%, the second period of decrease after five straight quarters of year-on-year growth.
Services had moderate gains totaling 0.6% on the quarter, with three of the four major sectors participating: trade and other consumer services, business and financial services and government. Transportation and communications was flat. The overall performance for services was slightly weaker than 0.7% in Q1 and yielded a year-over-year increase of 2.5%, the slowest since the spring of 2003.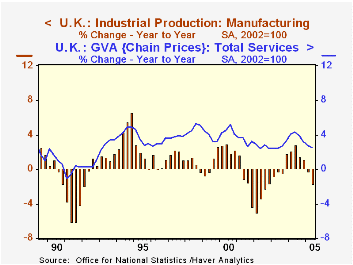
If these two bellwether sectors, manufacturing and services, were down or slower, how was Q2 GDP growth maintained at the Q1 rate? Mining activity including oil and gas extraction turned up after three successive, sizable declines. Renewed expansion in this industry sounds quite reasonable in view of the rapidly rising prices, but it remains to be seen if it will continue; during its general downtrend of the last three years, there have been isolated quarters of advance. The other expanding sector in Q1 was energy production, that is, electricity and other utilities. Construction output rose 0.4%, somewhat less than the 0.6% in Q1.
So all of this produced total GDP growth of 1.7% year-on-year, the smallest such increase since Q1 1993. We'd surmise that escalating energy costs are weighing on real growth. Also in the UK, base lending rates have been 4.75% for roughly the past year; in the face of just 2% consumer price inflation over that period, "real" interest charges are also exerting downward pressure. It shows.
| United Kingdom | Q2 2005 | Q1 2005 | Year/Year | 2004 | 2003 | 2002 |
|---|---|---|---|---|---|---|
| GDP | 0.4 | 0.4 | 1.7 | 3.2 | 2.5 | 2.0 |
| Manufacturing | -0.7 | -1.0 | -1.7 | 1.9 | 0.1 | -3.1 |
| Mining inc Oil Extraction | 1.4 | -0.5 | -7.3 | -7.9 | -5.2 | -0.3 |
| Services | 0.6 | 0.7 | 2.5 | 3.9 | 2.7 | 2.7 |

Tom Moeller
AuthorMore in Author Profile »Prior to joining Haver Analytics in 2000, Mr. Moeller worked as the Economist at Chancellor Capital Management from 1985 to 1999. There, he developed comprehensive economic forecasts and interpreted economic data for equity and fixed income portfolio managers. Also at Chancellor, Mr. Moeller worked as an equity analyst and was responsible for researching and rating companies in the economically sensitive automobile and housing industries for investment in Chancellor’s equity portfolio. Prior to joining Chancellor, Mr. Moeller was an Economist at Citibank from 1979 to 1984. He also analyzed pricing behavior in the metals industry for the Council on Wage and Price Stability in Washington, D.C. In 1999, Mr. Moeller received the award for most accurate forecast from the Forecasters' Club of New York. From 1990 to 1992 he was President of the New York Association for Business Economists. Mr. Moeller earned an M.B.A. in Finance from Fordham University, where he graduated in 1987. He holds a Bachelor of Arts in Economics from George Washington University.
More Economy in Brief


