 Global| Jan 12 2005
Lower Exports Dropped U.S. Trade Deficit To Another Record
by:Tom Moeller
|in:Economy in Brief
Summary
A surprising 2.3% drop in exports caused the U.S. foreign trade deficit to deepen sharply to $60.3B in November, by far a new record. Consensus expectations had been for a narrowing to $54.0B versus October's revised figure of $56.0B. [...]
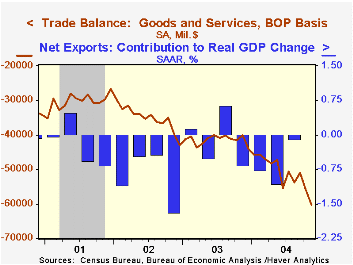
A surprising 2.3% drop in exports caused the U.S. foreign trade deficit to deepen sharply to $60.3B in November, by far a new record. Consensus expectations had been for a narrowing to $54.0B versus October's revised figure of $56.0B.
Goods exports, off 3.8%, fell across the board. A 5.1% (-0.7% y/y) decline in capital goods exports reflected sharp declines in exports of most types of machinery. Computer exports fell as well by 5.5% (+3.7% y/y) and exports of civilian aircraft plunged 8.4% (-34.5% y/y). Nonauto consumer goods exports were led 2.6% lower (+7.6% y/y) by steep declines in exports of appliances, furniture and apparel. Exports of food & beverages (-7.1% Y/Y) and industrial supplies +17.0% y/y) also were off sharply. The only major category to show an increase was "other goods", up 7.2% m/m.
Services exports rose 1.4% (7.2% y/y) due to increased travel and passenger fares.
Total imports rose 1.3% m/m though gains were mixed across categories. Imports of food as well as industrial supplies rose but capital goods imports fell 0.4% (+15.7% y/y) and automotive vehicles were off 2.3% (+4.7% y/y).
Imports of non-petroleum goods fell 0.6% (+14.7% y/y) while imports of petroleum surged 11.8% (79.0% y/y). The value of energy related petroleum products fell with lower oil prices but quantities rose (19.3% y/y).
The US trade deficit with China improved slightly to $16.6B ($124.1B in 2003) but the US trade deficit with Japan deepened to $7.3B ($66.0B in 2003) as did the deficit with the Asian NICs to $3.1B ($21.2B in 2003). The US trade deficit with the European Union deepened to $10.5B ($97.9B in 2003).
"To Float or Not to Float? Exchange Rate Regimes and Shocks" from the Federal Reserve Bank of San Francisco can be viewed here.
"U.S.–Mexico Trade: Are We Still Connected?" from the Federal Reserve Bank of Dallas can be found here.
| Foreign Trade | Nov | Oct | Y/Y | 2003 | 2002 | 2001 |
|---|---|---|---|---|---|---|
| Trade Deficit | $60.3B | $56.0B | $40.0B (11/03) | $496.5B | $421.7B | $362.7B |
| Exports - Goods & Services | -2.3% | 0.3% | 6.0% | 4.6% | -3.1% | -6.0% |
| Imports - Goods & Services | 1.3% | 3.6% | 19.8% | 8.5% | 2.1% | -5.5% |

Tom Moeller
AuthorMore in Author Profile »Prior to joining Haver Analytics in 2000, Mr. Moeller worked as the Economist at Chancellor Capital Management from 1985 to 1999. There, he developed comprehensive economic forecasts and interpreted economic data for equity and fixed income portfolio managers. Also at Chancellor, Mr. Moeller worked as an equity analyst and was responsible for researching and rating companies in the economically sensitive automobile and housing industries for investment in Chancellor’s equity portfolio. Prior to joining Chancellor, Mr. Moeller was an Economist at Citibank from 1979 to 1984. He also analyzed pricing behavior in the metals industry for the Council on Wage and Price Stability in Washington, D.C. In 1999, Mr. Moeller received the award for most accurate forecast from the Forecasters' Club of New York. From 1990 to 1992 he was President of the New York Association for Business Economists. Mr. Moeller earned an M.B.A. in Finance from Fordham University, where he graduated in 1987. He holds a Bachelor of Arts in Economics from George Washington University.
More Economy in Brief


