 Global| Oct 05 2007
Like a Bad Dream Ended, September U.S. Payrolls and Revisions Up
by:Tom Moeller
|in:Economy in Brief
Summary
September nonfarm payrolls increased 110,000, slightly ahead of expectations for a 100,000 rise. And like a bad dream gone with the light of the next day, the previously reporteddecline in August payrolls was revised away and now [...]
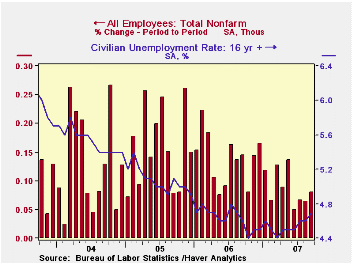
September nonfarm payrolls increased 110,000, slightly ahead of expectations for a 100,000 rise. And like a bad dream gone with the light of the next day, the previously reporteddecline in August payrolls was revised away and now shows an 89,000 increase. Adding to the good news was an upward revision to the July job gain as well.
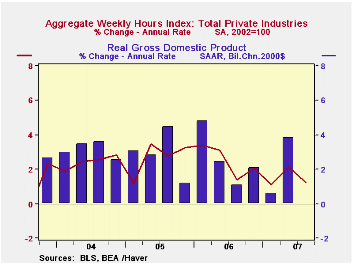
Aggregate hours worked rose 1.2% (AR) last quarter versus a 2.1% increase during 2Q. This slowdown very much suggests slower growth in GDP versus the 3.8% 2Q rise.
From the establishment survey, the big upward revision to August jobs was to government payrolls, now estimated up 57,000 (1.0% y/y) versus the previously reported 28,000 decline. In September, government payrolls rose 37,000.
The increase in September private service sector jobs is now pegged at 106,000 and the previously reported 88,000 August gain now stands at 96,000. This year, these industries added an average of 123,000 per month versus last year’s average of 159,000 per month.
The detail shows that retail employment fell 5,200 (+0.7% y/y) in September, the first decline since June. Financial sector jobs fell 14,000 (+0.5% y/y), the same as during a downwardly revised August. Professional & business services employment rose 21,000 (1.8% y/y) after an upwardly revised 18,000 August increase.
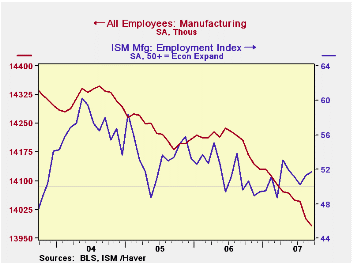
Factory sector payrolls fell 18,000 (-1.6 y/y) after a little revised 45,000 worker decline during August. The accompanying chart indicates that these declines are at odds with the recent ISM reports of job growth in manufacturing.
Construction employment fell yet again, by 14,000 last month after an unrevised 22,000 worker decline during August. Construction employment has fallen an average 8,000 per month this year versus an average 11,000 increase per month during 2006.
The unemployment rate ticked up to 4.7% last month as household employment surged 463,000 (0.9% y/y), more than making up a 316,000 August decline. The number of job losers fell 40,000 (+12.0 % y/y) after an 11,000 August decline. The average duration of unemployment fell sharply to 16.5 weeks and that's down from the recent peak of 17.3 weeks during March. The labor force also more than made for the prior month's decline with a 573,000 (1.1% y/y) jump. The labor force participation rate recovered to 66.0% after its August dip to 65.8% which was the lowest since March 2005. The BLS commentary for the August drop was that much of it occurred amongst teenagers, who were apparently returning to school.
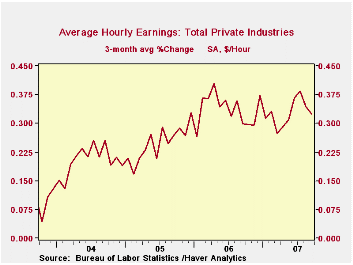
Average hourly earnings increased 0.4% after two monthly increases of 0.3%. As the chart shows these gains have decelerated lately. Factory sector earnings rose 0.2% (3.1% y/y) for the second month and private service producing earnings rose 0.4% for the fourth month in the last five.
Today's speech by Federal Reserve Vice ChairmanDonald L. Kohn on the Economic Outlook can be found here.
| Employment : 000s | September | August | July | Y/Y | 2006 | 2005 | 2004 |
|---|---|---|---|---|---|---|---|
| Payroll Employment | 110 | 89 | 93 | 1.2% | 1.9% | 1.7% | 1.1% |
| Previous | -- | -4 | 68 | -- | -- | -- | -- |
| Manufacturing | -18 | -45 | -4 | -1.6% | -0.2% | -0.6% | -1.3% |
| Construction | -14 | -22 | -16 | -1.4 | 4.8% | 5.2% | 3.6% |
| Average Weekly Hours | 33.8 | 33.8 | 33.8 | 33.8 (Sept '06) | 33.8 | 33.8 | 33.7 |
| Average Hourly Earnings | 0.4% | 0.3% | 0.3% | 4.1% | 3.9% | 2.8% | 2.1% |
| Unemployment Rate | 4.7% | 4.6% | 4.6% | 4.6% (Sept '06) | 4.6% | 5.1% | 5.5% |
by Carol Stone October 5, 2007
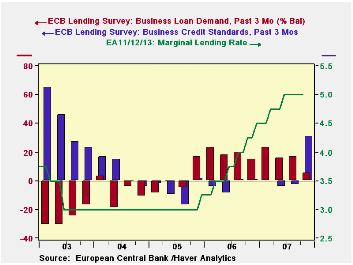
For the last 5 years, the European Central Bank (ECB) has conducted a quarterly survey of senior bank lending officers at a representative sample of European banking institutions. Ordinarily, the survey takes place during the first month of each quarter with reference to the prior quarter ("past 3 months") and the outlook for the current quarter ("next 3 months"). This time, however, the survey was advanced by a month to gain an earlier reading on the impact of the recent turmoil in world credit markets. The results do suggest that this situation has indeed had an impact.
Banks reported a sharp turn in lending policy toward businesses. They had been in a trend of gentle easing of credit standards since the middle of 2004, with readings in most quarters ranging from 0 to -10, where negative numbers indicate that more banks are easing than tightening up on lending practices and credit availability. In July, this measure was -3 but in this survey, just two months later (late September), it was +31 as many more banks shifted toward lending restraints on business customers. Details show this move was more potent for large companies (-1 to +33) as against small and medium-size firms (-7 to +15). It also hit long-term loans (-4 to +30) over short-term (-2 to +16). The survey also inquires about banks' expectations for their strategy in the coming three months; they look for about the same degree of tightening during Q4, at +28.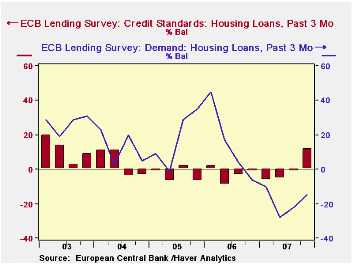
Businesses' demand for loans continued to expand in the latest survey, but at fewer banks than before. The demand reading was +17 in the July survey and averaged +19 in 2006. This latest figure is just +5, although bankers look for +11 in coming months.
Trends on loans to households differ. Banks report that they have tightened somewhat on home purchase lending, from a -1 rating in July to +12 in September; they expect slight further firming on credit conditions in the next few months, to +15. In contrast, they continued easing up on consumer credit and other loans, from -1 before to -3 most recently. They do, though, expect to tighten noticeably during Q4, to +11.
The bankers say that household loan demand is fairly weak, but this is also not a recent development. Demand for home purchase loans has been shrinking since Q4 2006, and in the latest two quarters has actually become somewhat less negative. The worst reading was April's -28, with a relative improvement to -22 in July and -15 in this latest survey. More weakening is anticipated, though, to -29 in the next 3 months. Other household lending has shown marginal gains in these last two quarters, although much less than earlier, as highlighted in the graph. A tiny net reduction is expected for the remainder of the year.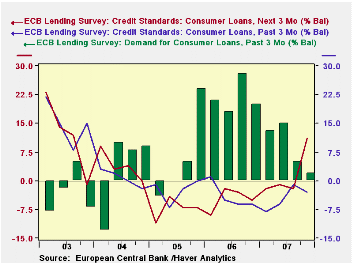
This survey shows significant alterations in credit policies, then, in the very most recent months, along with slowing credit demands. These new trends are mostly expected to continue. The main intended use for this survey is a source of information for the ECB policymakers, and these results would seem to describe that lending institutions themselves are tightening credit, even without any further rate change by the ECB since June.
| ECB Lending Survey, Net %-ages | Next 3 Months, Oct 2007 | Past 3 Months | |||||
|---|---|---|---|---|---|---|---|
| Oct 2007 | July 2007 | 2006 | 2005 | 2004 | 2003 | ||
| Credit Standards: + = Tighten, - = Ease | |||||||
| Business Loans | 28 | 31 | -3 | -3 | -7 | 7 | 40 |
| Housing Loans | 15 | 12 | -1 | -3 | -3 | 4 | 12 |
| Consumer Credit | 11 | -3 | -1 | -4 | -3 | 1 | 15 |
| Loan Demand | |||||||
| Business Loans | 11 | 5 | 17 | 19 | 1 | -8 | -26 |
| Housing Loans | -29 | -15 | -22 | 15 | 18 | 13 | 27 |
| Consumer Credit | -1 | 2 | 5 | 22 | 6 | 4 | -3 |
by Robert Brusca October 5, 2007
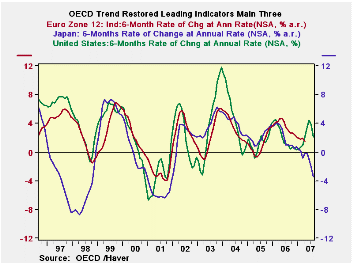
THE OECD leading economic indicators trend adjusted are showing a sharp moderation in the regional key indexes. The US is reversing sharply after embarking on a strong upturn earlier in the year. The Euro area is continuing to show waning momentum as that index works its way lower from its peak in mid-2006. Japan is sliding lower at a sharp pace that belies the optimism policy officials there embrace.
The OECD prefers to look over six-month horizons on its indicators so the table below arrays them two different ways. The six-month panel at the table bottom shows why the OECD talks of the indicators as pointing to moderation in growth. Only Europe and Japan are declining on the six-month horizon among these three main areas, yet all but the US are decelerating. The OECD area as a whole has its trend restored LEI rising with the index up by 09%.
But the three-month rate of change at the top of the table tells the story that the circumspect OECD does not want to center on. Yes, these are more volatile calculations and they could be reversed. But the shorter three-month trend tells us that all of these regions are pointing to a decline. Unless some stability sets in soon the six-month indexes will soon be reflecting this same sort of weakness and will point to DECLINES as well. On both approaches Japan looks like it is in trouble. These signals are not compatible with central banks hiking rates anytime soon.
| OECD Trend-Restored Leading Indicators | ||||
|---|---|---|---|---|
| Growth Progression-SAAR | ||||
| 3Mos | 6Mos | 12mos | Yr-Ago | |
| OECD | -1.8% | 0.9% | 1.3% | 2.8% |
| OECD 7 | -2.7% | 0.6% | 0.7% | 2.1% |
| OECD.Europe | -3.0% | -0.7% | 0.3% | 2.1% |
| OECD.Japan | -7.6% | -4.3% | -1.9% | 2.3% |
| OECD US | -0.3% | 3.1% | 2.1% | 2.2% |
| Six-Month Readings at 6-Mo Intervals: | ||||
| Recent six | 6Mo Ago | 12Mo Ago | 18MO Ago | |
| OECD | 0.9% | 1.7% | 0.8% | 4.9% |
| OECD 7 | 0.6% | 0.8% | -0.1% | 4.4% |
| OECD.Europe | -0.7% | 1.2% | 2.4% | 1.9% |
| OECD.Japan | -4.3% | 0.7% | 0.2% | 4.4% |
| OECD US | 3.1% | 1.1% | -0.9% | 5.4% |
| Slowdowns indicated by BOLD RED | ||||
by Robert Brusca October 5, 2007
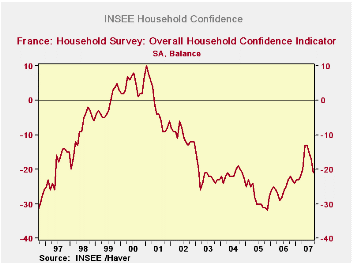
Household confidence in France fails to climb to or above -10.
The chart on French consumer confidence shows that there is something around the level of -10 on the index that seems critical to the development of the direction on the index. In 1994-95 the index was about to move above +10 and eventually dipped to -30 before soaring above -10 to reach a peak of +10 in late 2000. From that peak confidence fell but once it broke below 10 in 2002 its fall accelerated. Now as confidence has tried to recover again it has once again failed to reach -10 or to climb above it. With that failure, confidence has fallen back sharply. Various line items on confidence are weak with the exception of plans to save with that indicator in the top 12 percent of its lifetime range.
| INSEE Household Monthly Survey | ||||||||||
|---|---|---|---|---|---|---|---|---|---|---|
| Since Jan 1990 | Since Jan 1990 | |||||||||
| Sep 07 |
Aug 07 |
Jul 07 |
Jun 07 |
Percentile | Rank | Max | Min | Range | Mean | |
| Household Confidence | -21 | -17 | -15 | -13 | 27.9 | 109 | 10 | -33 | 43 | -17 |
| Living Standards | ||||||||||
| past 12 Mos | -50 | -47 | -46 | -45 | 19.0 | 139 | 18 | -66 | 84 | -37 |
| Next 12-Mos | -26 | -17 | -11 | -3 | 28.1 | 115 | 15 | -42 | 57 | -18 |
| Unemployment: Next 12 | 13 | 0 | -8 | -8 | 45.5 | 152 | 73 | -37 | 110 | 30 |
| Price Developments | ||||||||||
| Past 12Mo | 9 | 5 | 1 | -8 | 75.9 | 27 | 30 | -57 | 87 | -20 |
| Next 12-Mos | -15 | -20 | -26 | -28 | 49.5 | 16 | 31 | -60 | 91 | -34 |
| Savings | ||||||||||
| Favorable to save | 36 | 35 | 33 | 34 | 88.9 | 8 | 40 | 4 | 36 | 23 |
| Ability to save Next 12 | -6 | -5 | -4 | -4 | 58.6 | 67 | 6 | -23 | 29 | -8 |
| Spending | ||||||||||
| Favorable for major purchase | -8 | -6 | -3 | -7 | 58.6 | 51 | 16 | -42 | 58 | -12 |
| Financial Situation | ||||||||||
| Current | 16 | 15 | 15 | 14 | 61.9 | 39 | 24 | 3 | 21 | 12 |
| Past 12 MOs | -15 | -14 | -14 | -11 | 54.5 | 68 | -5 | -27 | 22 | -16 |
| Next 12-Mos | -4 | -3 | -1 | 4 | 44.4 | 159 | 11 | -16 | 27 | 0 |
| Number of observations in the period 208 | ||||||||||

Tom Moeller
AuthorMore in Author Profile »Prior to joining Haver Analytics in 2000, Mr. Moeller worked as the Economist at Chancellor Capital Management from 1985 to 1999. There, he developed comprehensive economic forecasts and interpreted economic data for equity and fixed income portfolio managers. Also at Chancellor, Mr. Moeller worked as an equity analyst and was responsible for researching and rating companies in the economically sensitive automobile and housing industries for investment in Chancellor’s equity portfolio. Prior to joining Chancellor, Mr. Moeller was an Economist at Citibank from 1979 to 1984. He also analyzed pricing behavior in the metals industry for the Council on Wage and Price Stability in Washington, D.C. In 1999, Mr. Moeller received the award for most accurate forecast from the Forecasters' Club of New York. From 1990 to 1992 he was President of the New York Association for Business Economists. Mr. Moeller earned an M.B.A. in Finance from Fordham University, where he graduated in 1987. He holds a Bachelor of Arts in Economics from George Washington University.
More Economy in Brief


