 Global| May 19 2005
Leading Indicators Down Again
by:Tom Moeller
|in:Economy in Brief
Summary
The Composite Index of Leading Economic Indicators reported by the Conference Board fell for the fourth straight month in April. The 0.2% decline followed a downwardly revised 0.6% drop in March. Six-month growth in the leaders fell [...]
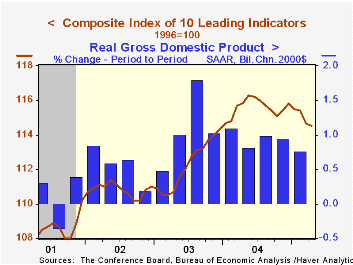
The Composite Index of Leading Economic Indicators reported by the Conference Board fell for the fourth straight month in April. The 0.2% decline followed a downwardly revised 0.6% drop in March. Six-month growth in the leaders fell further to -1.0%. Growth in the leaders deeper than -2.5% preceded past US recessions.
During the last ten years there has been a 50% correlation between the six-month change in the leading indicators and the change in real GDP.
The breadth of one month gain amongst the 10 components of the leading index improved markedly to 50% from just 10% in March. Higher building permits and lower claims for unemployment insurance offset negative contributions from stock prices, the yield curve and the money supply.
The leading index is based on eight previously reported economic data series. Two series, orders for consumer goods and orders for capital goods, are estimated.
The coincident indicators rose 0.2% for the second month. Six-month growth in the index was 2.5% and during the last ten years there has been an 84% correlation between six month growth in the coincident indicators and two quarter growth in real GDP.
The lagging indicators rose 0.4% mostly due to higher C&I loans.
The ratio of the coincident to the lagging indicators which measures actual economic performance relative to excess fell for the third month this year.
Visit the Conference Board's site for coverage of leading indicator series from around the world.
New Economy-New Policy Rules? from the Federal Reserve Bank of St. Louis is available here.
| Business Cycle Indicators | April | March | 6-Month Chg | 2004 | 2003 | 2002 |
|---|---|---|---|---|---|---|
| Leading | -0.2% | -0.6% | -0.5% | 2.9% | 1.3% | 2.2% |
| Coincident | 0.2% | 0.2% | 3.1% | 2.6% | 0.4% | -0.5% |
| Lagging | 0.4% | -0.2% | 0.4% | -2.1% | -1.9% | -2.3% |
by Tom Moeller May 19, 2005
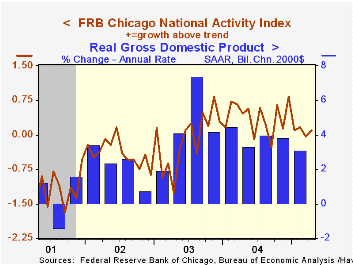
In April the National Activity Index (CFNAI) compiled by the Federal Reserve Bank of Chicago improved to 0.10 from a downwardly revised -0.04 in March.
The figures left the three-month moving average of the CFNAI at 0.08, its lowest since 2003. A zero value of the CFNAI indicates that the economy is expanding at its historical trend rate of growth.
The CFNAI is a weighted average of 85 indicators of economic activity. The indicators reflect activity in the following categories: production and income, the labor market, personal consumption and housing, manufacturing and trade sales, and inventories & orders.
During the last twenty years there has been a 74% correlation between the level of the CFNAI and q/q growth in real GDP.
The latest CFNAI report is available here.
M2 and "Reigniting Inflation" from the Federal Reserve Bank of St. Louis can be found here.
| Chicago Fed | April | March | April '04 | 2004 | 2003 | 2002 |
|---|---|---|---|---|---|---|
| CFNAI | 0.10 | -0.04 | 0.47 | 0.39 | -0.11 | -0.40 |
by Tom Moeller May 19, 2005
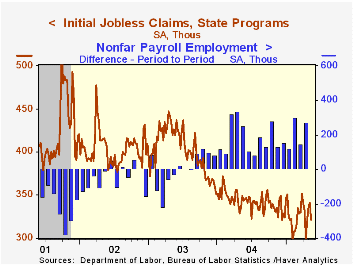
Following three weeks of increase, initial claims for unemployment insurance fell 20,000 last week to 321,000 and the prior period's gain was little revised. Consensus expectations had been for 330,000 claims.
The latest figure covers the survey period for May nonfarm payrolls and claims are up 22,000 (7.4%) from the April period.
During the last ten years there has been a (negative) 75% correlation between the level of initial claims for unemployment insurance and the monthly change in payroll employment. There has been a (negative) 65% correlation with the level of continuing claims.
The four week moving average of initial claims rose to 329,750 (-2.6% y/y).
Continuing claims for unemployment insurance rose 5,000 and the prior week's gain was little revised.
The insured unemployment rate held at 2.0% for the fourth consecutive weeks.
This morning's speech titled Government-sponsored enterprises by Fed Chairman Alan Greenspan can be found here.
| Unemployment Insurance (000s) | 05/14/05 | 05/07/05 | Y/Y | 2004 | 2003 | 2002 |
|---|---|---|---|---|---|---|
| Initial Claims | 321 | 341 | -8.0% | 343 | 402 | 404 |
| Continuing Claims | -- | 2,601 | -11.7% | 2,926 | 3,531 | 3,570 |
by Carol Stone May 19, 2005
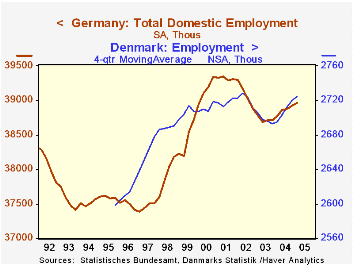
Employment conditions in several countries are showing some improvement. After about three years of decline or sluggishness, uptrends are developing in the number of people employed. This is evident in Germany, where seasonally adjusted employment rose 38,000 in Q1, extending the recent string of gains to a fifth quarter. At 39.965 million, the level is the highest since the third quarter of 2002. Before seasonal adjustment, the figure is 39.579 million, up 0.5% from a year ago.
In Denmark, the lack of seasonal adjustment makes the comparisons less obvious, but gains are there, nonetheless. At 2.698 million in Q1, jobs are up 0.7% from a year ago and achieved the highest Q1 total since 1999. As seen in the first graph, the 4-quarter moving average has been rising since Q1 2004.
In both of these countries, it is the service sector where turnarounds are evolving. In Germany, this segment, represented by total employment less agriculture, industry and construction, was up in Q1 by 356,000 from a year ago, growth of 1.3%. Industry employment is still decreasing, down 1.2% in the same time span. This is, however, a slower pace of decline than was experienced from the beginning of 2002 to the middle of last year. Quarterly patterns are more erratic in Denmark, but recent 4-quarter growth rates in service industries have also averaged 1.3%. Industry employment is still weak, but looks to be trying to bottom out, maintaining a tight range around 440,000 for the last year.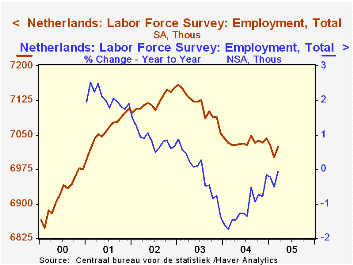
Finally, in the Netherlands, total employment hit a new cyclical low of 7.001 million (seasonally adjusted) in February, but rebounded to 7.024 million in March. These data are expressed as three-month centered moving averages, so the good rise reported for March (average of February, March and April) suggests that the April figure alone probably had a more significant increase. As it stands, before seasonal adjustment, the March level is just barely below March 2004, the least weak reading since August 2003.
| Industrial Countries Not Seasonally Adjusted |
Mar 2005 | Feb 2005 | Year Ago | 2004 | 2003 | 2002 |
|---|---|---|---|---|---|---|
| Germany-Total Employment | 38579* | 38376* | 38861 | 38720 | 39092 | |
| Industry | 7910* | 8009* | 8018 | 8139 | 8356 | |
| Services | 27743* | 27387* | 27708 | 27379 | 27392 | |
| Netherlands - Employment | 7024 | 7001 | 7033 | 7036 | 7113 | 7123 |
| Denmark - Employment | 2698* | 2680* | 2720 | 2693 | 2712 |

Tom Moeller
AuthorMore in Author Profile »Prior to joining Haver Analytics in 2000, Mr. Moeller worked as the Economist at Chancellor Capital Management from 1985 to 1999. There, he developed comprehensive economic forecasts and interpreted economic data for equity and fixed income portfolio managers. Also at Chancellor, Mr. Moeller worked as an equity analyst and was responsible for researching and rating companies in the economically sensitive automobile and housing industries for investment in Chancellor’s equity portfolio. Prior to joining Chancellor, Mr. Moeller was an Economist at Citibank from 1979 to 1984. He also analyzed pricing behavior in the metals industry for the Council on Wage and Price Stability in Washington, D.C. In 1999, Mr. Moeller received the award for most accurate forecast from the Forecasters' Club of New York. From 1990 to 1992 he was President of the New York Association for Business Economists. Mr. Moeller earned an M.B.A. in Finance from Fordham University, where he graduated in 1987. He holds a Bachelor of Arts in Economics from George Washington University.
More Economy in Brief


