 Global| Apr 21 2005
Leading Indicators Down
by:Tom Moeller
|in:Economy in Brief
Summary
The Composite Index of Leading Economic Indicators reported by the Conference Board fell 0.4% in March, the second decline in three months. Six-month growth in the leaders fell further to -0.5%. Growth in the leaders deeper than -2.5% [...]
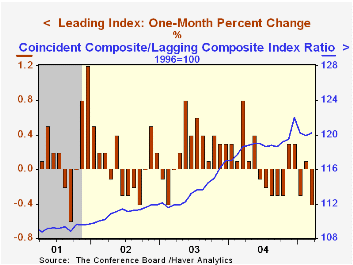
The Composite Index of Leading Economic Indicators reported by the Conference Board fell 0.4% in March, the second decline in three months. Six-month growth in the leaders fell further to -0.5%. Growth in the leaders deeper than -2.5% preceded past US recessions.
The breadth of one month gain amongst the 10 components of the leading index fell to a paltry 20% from a downwardly revised 40% in February. Higher claims for unemployment insurance had the largest negative effect pulling the leading index lower. Higher consumer goods orders and a steeper interest rate yield curve had the only positive influences.
The leading index is based on eight previously reported economic data series. Two series, orders for consumer goods and orders for capital goods, are estimated.
The coincident indicators rose 0.2% following a downwardly revised 0.1% gain in February. Six-month growth in the index was 3.1% and during the last ten years there has been an 84% correlation between six month growth in the coincident indicators and two quarter growth in real GDP.
The lagging indicators fell 0.1% due to a longer duration of unemployment and higher C&I loans.
The ratio of the coincident to the lagging indicators which measures actual economic performance relative to excess rose 0.3% (1.3% y/y) following a revised decline the prior month.
Visit the Conference Board's site for coverage of leading indicator series from around the world.
Chairman Alan Greenspan's testimony on Budget process reforms is available here.
| Business Cycle Indicators | Mar | Feb | 6-Month Chg | 2004 | 2003 | 2002 |
|---|---|---|---|---|---|---|
| Leading | -0.4% | 0.1% | -0.5% | 3.0% | 1.3% | 2.2% |
| Coincident | 0.2% | 0.1% | 3.1% | 2.6% | 0.4% | -0.5% |
| Lagging | -0.1% | 0.3% | 0.4% | -2.1% | -1.9% | -2.3% |
by Tom Moeller April 21, 2005
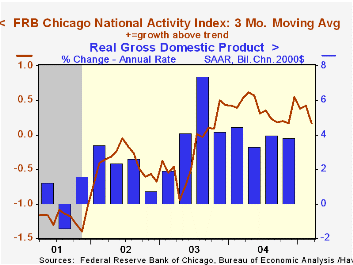
The National Activity Index (CFNAI) compiled by the Federal Reserve Bank of Chicago fell to 0.11 in March, the lowest level since last September.A zero value of the CFNAI indicates that the economy is expanding at its historical trend rate of growth.
The decline lowered the three-month moving average of the CFNAI to 0.17, its lowest since November.
The CFNAI is a weighted average of 85 indicators of economic activity. The indicators reflect activity in the following categories: production and income, the labor market, personal consumption and housing, manufacturing and trade sales, and inventories & orders.
During the last twenty years there has been a 74% correlation between the level of the CFNAI and q/q growth in real GDP.
The latest CFNAI report is available here.
The latest Beige Book covering regional economic activity from the Federal Reserve Board is available here.
| Chicago Fed | Mar | Feb | Mar '04 | 2004 | 2003 | 2002 |
|---|---|---|---|---|---|---|
| CFNAI | 0.11 | 0.22 | 0.67 | 0.39 | -0.11 | -0.40 |
by Tom Moeller April 21, 2005
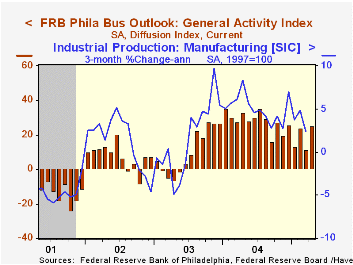
The Philadelphia Fed's April Index of General Business Conditions in the manufacturing sector recovered all of the prior month's decline and rose to 25.3. Consensus expectations had been for a lesser increase to 14.0.
During the last ten years there has been a 69% correlation between the level of the Philadelphia Fed Business Conditions Index and three month growth in factory sector industrial production. There has been a 52% correlation with q/q growth in real GDP.
The shipments index more than doubled the prior month's level and rose to its highest since August. The new orders index also rose sharply to the highest level of the year. The number of employees index recovered most of the prior two months' decline. During the last ten years there has been a 64% correlation between the employment index and the three month growth in factory payrolls.
The business conditions index reflects a separate survey question, not the sub indexes.
The separate index of expected business conditions in six months improved moderately to the highest level this year.
The prices paid index also recovered much of the prior two months' decline. During the last ten years there has been a 75% correlation between the prices paid index and the three month growth in the intermediate goods PPI. The correlation with the finished goods PPI has been 50% and with the CPI it's been 43%.
The Philadelphia Fed index is based on a survey of 250 regional manufacturing firms, but these firms sell nationally and internationally.
The latest Business Outlook survey from the Philadelphia Federal Reserve Bank can be found here.
| Philadelphia Fed Business Outlook | April | Mar | April '04 | 2004 | 2003 | 2002 |
|---|---|---|---|---|---|---|
| General Activity Index | 25.3 | 11.4 | 32.8 | 28.1 | 10.6 | 7.7 |
| Prices Paid Index | 50.5 | 29.7 | 51.3 | 51.3 | 16.8 | 12.3 |
by Tom Moeller April 21, 2005
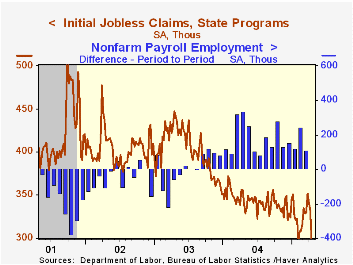
Initial unemployment insurance claims dropped a sharp 36,000 last week to 296,000. The prior week's 9,000 decline was little revised and it marked the third drop in as many weeks, to the lowest level since late 2000. Consensus expectations had been for 326,000 claims.
The figure covered the survey period for April nonfarm payrolls and was down 33,000 (10.0%) from the March period. The size of the drop may have been magnified by the early timing of Easter this year.
During the last ten years there has been a (negative) 75% correlation between the level of initial claims for unemployment insurance and the monthly change in payroll employment. There has been a (negative) 65% correlation with the level of continuing claims.
The four week moving average of initial claims fell to 330,250 (-5.4% y/y).
Continuing claims for unemployment insurance fell 17,000 following a deepened 31,000 decline the prior week.
The insured unemployment rate remained at 2.1%.
How Do Local Labor Markets in the U.S. Adjust to Immigration? from the Federal Reserve Bank of Philadelphia is available here.
| Unemployment Insurance (000s) | 04/16/05 | 04/09/05 | Y/Y | 2004 | 2003 | 2002 |
|---|---|---|---|---|---|---|
| Initial Claims | 296 | 332 | -16.9% | 343 | 402 | 404 |
| Continuing Claims | -- | 2,638 | -12.3% | 2,926 | 3,531 | 3,570 |
by Carol Stone April 21, 2005
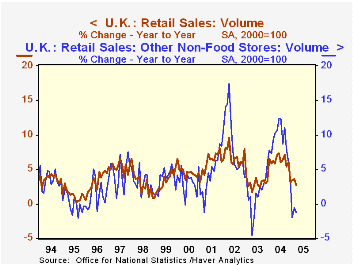
Retail sales in the UK are flagging, according to the most recent couple of months' data from the Office of National Statistics. In March, sales values rose 0.2% from February, the same size gain as for February from January. These moves yielded a 3.0% increase from March 2004, compared with a 4.7% increase for all of 2004.
The swing was wider in the corresponding volume results, that is, adjusted for inflation. Sales fell in March by 0.1% and were 3.7% ahead of a year ago. But 2004 as a whole saw 6.0% growth from 2003, making the recent performance a moderation of 2.3 percentage points. By store category, the weakening occurred in nonfood store sales and non-store sales and repair. (Internet sales by retailers having stores are included in the sales of the relevant store group.) Household goods and "other" nonfood stores experienced the greatest degree of slowing.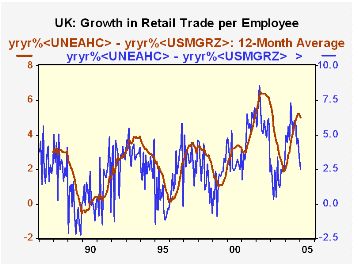
It might be argued that weakening retail sales growth would result from weakening employment. However, employment growth in the UK hasn't changed much in recent months. The 0.8% in the January figure (3-month average, here representing December, January and February) is very much in line with the pace prevailing during most of last year. Thus, the smaller gains in retail trade are resulting from more sluggish spending by individual employees, not fewer employees. See the second graph, which shows a progressive deceleration in sales/employee. We can surmise that this might arise from rising energy costs, which would be absorbing more consumer income. Indeed, detailed National Accounts data through Q4 2004 indicate major increases in the costs of household utilities and vehicle fuels. GDP totals for Q1 will be reported tomorrow, 22 April. But the breakdown of expenditure detail won't be available until the June release of the national accounts. So for the present, our supposition about the role of energy must remain conditional. Then again, the recent slower pattern of retail trade may only be a reaction to more rapid expansion during 2004.
| % Changes | Mar 2005 | Feb 2005 | Jan 2005 | Year Ago | 2004 | 2003 | 2002 |
|---|---|---|---|---|---|---|---|
| Total Value | 0.2 | 0.2 | 0.8 | 3.0 | 4.7 | 2.0 | 5.3 |
| Total Volume | -0.1 | 0.3 | 0.6 | 3.7 | 6.0 | 2.9 | 6.5 |
| Mostly Food | 0.0 | -0.3 | 1.9 | 4.5 | 4.1 | 3.3 | 4.1 |
| Mostly Non- Food Stores | 0.2 | 0.5 | -0.1 | 3.3 | 7.2 | 3.5 | 8.4 |
| Non-Stores | -3.8 | 3.5 | -0.2 | 2.5 | 9.4 | -5.0 | 7.2 |

Tom Moeller
AuthorMore in Author Profile »Prior to joining Haver Analytics in 2000, Mr. Moeller worked as the Economist at Chancellor Capital Management from 1985 to 1999. There, he developed comprehensive economic forecasts and interpreted economic data for equity and fixed income portfolio managers. Also at Chancellor, Mr. Moeller worked as an equity analyst and was responsible for researching and rating companies in the economically sensitive automobile and housing industries for investment in Chancellor’s equity portfolio. Prior to joining Chancellor, Mr. Moeller was an Economist at Citibank from 1979 to 1984. He also analyzed pricing behavior in the metals industry for the Council on Wage and Price Stability in Washington, D.C. In 1999, Mr. Moeller received the award for most accurate forecast from the Forecasters' Club of New York. From 1990 to 1992 he was President of the New York Association for Business Economists. Mr. Moeller earned an M.B.A. in Finance from Fordham University, where he graduated in 1987. He holds a Bachelor of Arts in Economics from George Washington University.
More Economy in Brief


