 Global| Feb 03 2006
Large Shipments to China Help Australia Trade Balance
Summary
International trade for Australia looks to be very dynamic process. The trade balance widened to a significant deficit in 2003 and 2004, but moderated considerably in 2005, mirroring a pattern of decline and then rapid turnaround in [...]
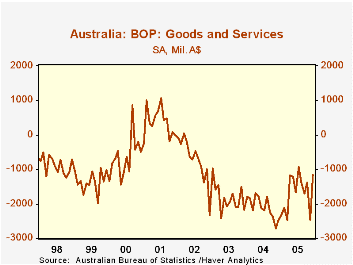
International trade for Australia looks to be very dynamic process. The trade balance widened to a significant deficit in 2003 and 2004, but moderated considerably in 2005, mirroring a pattern of decline and then rapid turnaround in exports. Exports fell 9.3% in 2003, but recovered almost exactly that amount in 2004. Then last year, they surged ahead 17.8% for the year as a whole, with 9.0% in the month of December alone over November. Exports in December, as seen in the table below, grew a whopping 28.5% from December 2004.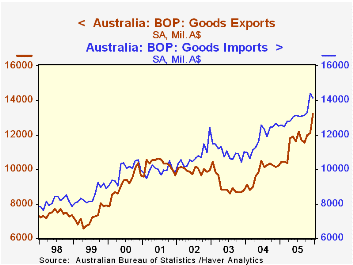
At the same time, imports have not been sluggish, as they were up 10% for 2005 as a whole. As elsewhere, some of this was oil-price related, with imports of mineral fuels, lubricants and related up 34% for the year, following 28% in 2004. Chemicals also rose by more than 10%. Other manufactured goods weren't that strong, but they gained in a range of 8%-9%, so they were hardly weak.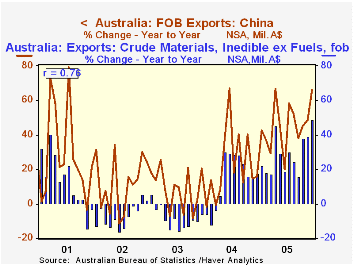
The two most interesting developments in Australian trade -- at least in our view -- concern metals exports and exports to China. These may be related, but available data can't confirm that. The third graph is very suggestive, however. Exports to China rose 45.5% in 2005, with a final spurt in December carrying them to A$1.8 billion, up nearly 66% from December 2004. (For comparison, shipments to the US, which were larger than those to China as recently as 2003, were relatively flat at about A$800 million/month from then until late last year.) Among kinds of goods Australia has exported, non-food crude materials also increased substantially, 29% for the year and 49% December-on-December. Over the past five years, the monthly pattern of the year-to-year changes in these raw materials has a 76% correlation with growth in exports to China. Australia is a major producer of copper and aluminum; it may well be that they are shipping considerable quantities of those metals to their large neighbor to the north. This would bode well for both countries, a fine illustration of the "gains from trade", and would help minimize Australia's trade deficit with China.
| Australia Trade (Mil.A$) | Month/MonthYr/Yr | Monthly Average||||||
|---|---|---|---|---|---|---|---|
| Dec 2005* | Nov 2005* | Oct 2005* | Dec 2004* | 2005 | 2004 | 2003 | |
| Goods & Services: Balance | -1168 | -2473 | -1371 | -2480 | -1668 | -2102 | -1818 |
| Goods: Exports | 13214 | 12129 | 11999 | 10229 | 11619 | 9848 | 9067 |
| % Change | 9.0 | 1.1 | 3.8 | 28.5** | 17.8 | 9.4 | -9.3 |
| Goods: Imports | 14150 | 14227 | 13285 | 12502 | 13163 | 11875 | 10974 |
| % Change | -1.9 | 8.6 | 1.1 | 9.3** | 10.1 | 8.7 | 1.7 |
| China: Exports (NSA) | 1827 | 1419 | 1509 | 1102 | 1336 | 918 | 757 |
| USA: Exports (NSA) | 914 | 840 | 773 | 835 | 772 | 796 | 788 |
Carol Stone, CBE
AuthorMore in Author Profile »Carol Stone, CBE came to Haver Analytics in 2003 following more than 35 years as a financial market economist at major Wall Street financial institutions, most especially Merrill Lynch and Nomura Securities. She had broad experience in analysis and forecasting of flow-of-funds accounts, the federal budget and Federal Reserve operations. At Nomura Securities, among other duties, she developed various indicator forecasting tools and edited a daily global publication produced in London and New York for readers in Tokyo. At Haver Analytics, Carol was a member of the Research Department, aiding database managers with research and documentation efforts, as well as posting commentary on select economic reports. In addition, she conducted Ways-of-the-World, a blog on economic issues for an Episcopal-Church-affiliated website, The Geranium Farm. During her career, Carol served as an officer of the Money Marketeers and the Downtown Economists Club. She had a PhD from NYU's Stern School of Business. She lived in Brooklyn, New York, and had a weekend home on Long Island.
More Economy in Brief


