 Global| Mar 24 2008
Large Japanese Business Firms Turn More Pessimistic
Summary
The Japanese Economic and Social Research Institute of the Cabinet Office and the Policy Research Institute of the Ministry of Finance (MOF) have surveyed industry leaders of some 15,000 firms and analyzed their assessments and [...]
 The Japanese Economic and
Social Research Institute of the
Cabinet Office and the Policy Research Institute of the Ministry of
Finance (MOF) have surveyed industry leaders of some 15,000 firms and
analyzed their assessments and forecasts of a number of important
business trends in the current quarter, the next quarter and the
quarter after next. The results are given for large (capital of 1
billion yen and over), medium (capital of 100 million to 1 billion yen)
and small (capital of 10 to 100 million yen) businesses. For each size
group, results for all industry, manufacturing and non manufacturing
industry are given. Complete results of the survey can be found in the
Haver series BUSINESS OUTLOOK SURVEY (M0F) in the BUSINESS CYCLE
INDICATORS AND SURVEY section of the JAPAN data
base. The survey was begun in 2004, and over its short life has tended
to anticipate results of the Bank of Japan's Tankan, Japan's most
closely watched indicator of the business outlook. The next Tankan
results are due on April 1st.
The Japanese Economic and
Social Research Institute of the
Cabinet Office and the Policy Research Institute of the Ministry of
Finance (MOF) have surveyed industry leaders of some 15,000 firms and
analyzed their assessments and forecasts of a number of important
business trends in the current quarter, the next quarter and the
quarter after next. The results are given for large (capital of 1
billion yen and over), medium (capital of 100 million to 1 billion yen)
and small (capital of 10 to 100 million yen) businesses. For each size
group, results for all industry, manufacturing and non manufacturing
industry are given. Complete results of the survey can be found in the
Haver series BUSINESS OUTLOOK SURVEY (M0F) in the BUSINESS CYCLE
INDICATORS AND SURVEY section of the JAPAN data
base. The survey was begun in 2004, and over its short life has tended
to anticipate results of the Bank of Japan's Tankan, Japan's most
closely watched indicator of the business outlook. The next Tankan
results are due on April 1st.
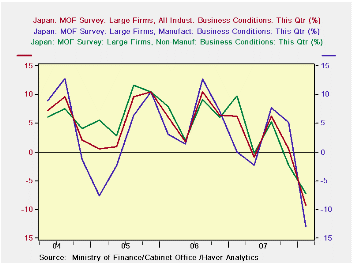
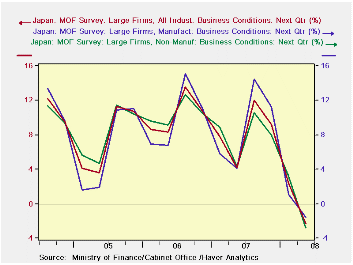
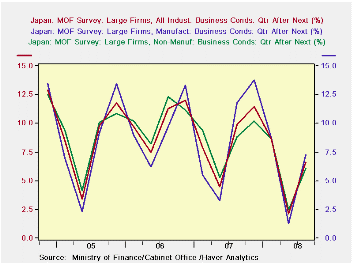
The current Cabinet Office and MOF survey, which was conducted on February 25, was released today. Among the many results of the survey, those for the large firms are frequently high lighted. For all industry in large firms, the pessimists exceeded optimists by 9.3 % in their appraisal of conditions in the current quarter. In non manufacturing industry the excess of pessimists was 7.2%, and for manufacturing, 12.9%. These were the most pessimistic outlooks in the short history of the measure, as can be seen in the first chart. Similar results were shown for the assessment of large manufacturing firms for the next quarter, as shown in the second chart. However, for the quarter after the next, optimists prevailed. The excess of optimists for all industry was 6.6%, for non manufacturing, 6.1% and for manufacturing, 7.3%, as can be seen in the third chart. In general, the appraisals for conditions in the quarter after next show an excess of optimists over pessimists. "Hope spring eternal in the human breast, / Man never is, but always to be blest."
| BUSINESS
OUTLOOK SURVEY, CABINET OFFICE & MOF (% Balance) |
Q1 08 | Q4 07 | Q1 07 | Q/Q Chg | Y/Y Chg | 2006 | 2005 | 2004 |
|---|---|---|---|---|---|---|---|---|
| Large Firms Current Quarter | ||||||||
| All Industry | -9.3 | 0.5 | 6.2 | -9.8 | -15.5 | 3.0 | 6.2 | 5.4 |
| Manufacturing | -12.9 | 5.2 | 0.1 | -18.1 | -13.0 | 2.7 | 6.1 | 1.7 |
| Non Manufacturing | -7.2 | -2.2 | -9.8 | -5.0 | -17.0 | 3.2 | 6.3 | 7.6 |
| Large Firms Next Quarter | Q2 08 | Q1 08 | Q2 07 | Q/Q Chg | Y/Y Chg | 2006 | 2005 | 2004 |
| All Industry | -2.3 | 2.4 | 4.2 | -4.70 | -6.5 | 8.3 | 10.3 | 7.4 |
| Manufacturing | -1.6 | 1.1 | 4.1 | -2.7 | -5.7 | 6.4 | 10.0 | 8.9 |
| Non Manufacturing | -2.8 | 3.2 | 4.3 | -6.0 | -7.1 | 7.9 | 10.5 | 8.1 |
| Large Firms Quarter after Next | Q3 08 | Q2 08 | Q3 07 | Q/Q Chg | Y/Y Chg | 2006 | 2005 | 2004 |
| All Industry | 6.6 | 2.1 | 9.9 | 4.5 | -3.3 | 8.4 | 10.1 | 8.4 |
| Manufacturing | 7.3 | 1.3 | 11.8 | 6.0 | -4.5 | 8.6 | 9.6 | 8.0 |
| Non Manufacturing | 6.1 | 2.5 | 8.8 | 3.6 | -2.7 | 8.4 | 10.5 | 8.6 |
More Economy in Brief


