Global| Jun 08 2007
Land of the Setting Sun? Japan’s Surveys Falter Again…
Summary
Japans economy watchers survey cycled higher from late 2004 through early 2005. Then it dropped off until picking up to a minor peak in August 2006. From that mini- peak it spread out on a gradual increase until it fell sharply [...]
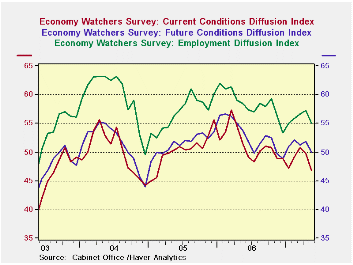
Japan’s economy watcher’s survey cycled higher from late 2004 through early 2005. Then it dropped off until picking up to a minor peak in August 2006. From that mini- peak it spread out on a gradual increase until it fell sharply again in May, the figure reported today – a sharp drop.
The employment and future indexes are cycling in concert but with smaller amplitudes.
The Teikoku indexes and NTC MFG survey echo the findings of weakness but the various surveys find weakness in differing magnitudes. See table below.
The far right columns put the recent observations for each index or sub-reading in the context of its five year max or min. This allows us to compared intrinsically different indicators.
Results show that the NTC MFG index is the weakest in the 30th percentile of its range for this period. Next in line comes the economy watcher index and its components with the headline index at 44.4% of its range. The Teikoku indices are the strongest with MFG relatively firm at a range reading of 75% (top 25% of its range) and with retail the relative weakest at 64% of its range. Wholesale services and construction are relatively healthy in the Teikoku scheme. Even so the Teikoku indices are dropping and all sectors dropped again in May. They made their local peak about one year and have been slipping slowly ever since.
| Raw readings of each survey | Percent of 5Yr range* | ||||||
| May-07 | Apr-07 | Mar-07 | Feb-07 | May-07 | Apr-07 | Mar-07 | |
| Diffusion | |||||||
| Economy Watchers | 46.8 | 49.7 | 50.8 | 49.2 | 44.4% | 59.8% | 65.6% |
| Employment | 50.7 | 57.1 | 56.3 | 55.9 | 35.6% | 63.1% | 59.7% |
| Future | 50.0 | 51.9 | 51.3 | 52.1 | 52.9% | 68.0% | 70.6% |
| NTC MFG | 51.4 | 52.3 | -- | -- | 30.2% | 41.4% | 43.5% |
| Econ Trends (Teikoku'/50 neutral/weighted diffusion) | |||||||
| MFG | 45.2 | 47.0 | 47.2 | 46.7 | 76.2% | 85.1% | 86.2% |
| Retail | 39.6 | 41.1 | 41.1 | 39.9 | 64.3% | 74.3% | 74.3% |
| Wholesale | 42.8 | 44.3 | 44.6 | 43.8 | 75.6% | 83.5% | 85.8% |
| Services | 49.1 | 50.3 | 49.9 | 49.4 | 88.4% | 93.6% | 92.2% |
| Construction | 37.7 | 38.4 | 38.7 | 38.7 | 84.4% | 89.2% | 91.2% |
| 100 is high; Zero is low | |||||||

Robert Brusca
AuthorMore in Author Profile »Robert A. Brusca is Chief Economist of Fact and Opinion Economics, a consulting firm he founded in Manhattan. He has been an economist on Wall Street for over 25 years. He has visited central banking and large institutional clients in over 30 countries in his career as an economist. Mr. Brusca was a Divisional Research Chief at the Federal Reserve Bank of NY (Chief of the International Financial markets Division), a Fed Watcher at Irving Trust and Chief Economist at Nikko Securities International. He is widely quoted and appears in various media. Mr. Brusca holds an MA and Ph.D. in economics from Michigan State University and a BA in Economics from the University of Michigan. His research pursues his strong interests in non aligned policy economics as well as international economics. FAO Economics’ research targets investors to assist them in making better investment decisions in stocks, bonds and in a variety of international assets. The company does not manage money and has no conflicts in giving economic advice.
More Economy in Brief