 Global| Apr 26 2007
Kansas City Fed Index Jumps
Summary
The tunnel chart on KC production says it all in a nutshell. The index has been weak. In July 2006 the production index sank below its 12-mont moving average and has more or less stayed there. It has been fluctuating sharply in early [...]
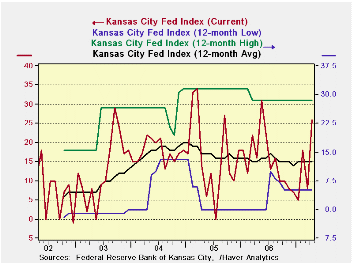
The tunnel chart on KC production says it all in a nutshell. The index has been weak. In July 2006 the production index sank below its 12-mont moving average and has more or less stayed there. It has been fluctuating sharply in early 2007 but in April it has made a sharp break higher. The production reading that has jumped to +25 for production is in the top 25 percentile of all readings for production for this index and that is a fairly strong showing. The jump is out of character with the small rises we saw in NY and in Philadelphia and weaker reading in Richmond. But as the regional Consumer Confidence readings showed us, the strength in the economy is really OUT WEST. So KC is strong and getting stronger. This is one time I hope to root for the West Coast… or at least things the other side of the Continental Divide (which the KC district bridges).
Unfortunately, one message in the chart above is that spikes in the production index tend to give way - to back off -- so while we can be encouraged by the KC reading it is only one month, after all.
The KC Fed has three different sorts of surveys. We reported at the top on the m/m survey. That is akin to most MFG surveys we see. It also has a more unusual year/year diffusion survey and a somewhat more common 6-month outlook survey. We have combined all these results into one table across the various components, provided the raw months scores as well as a second panel that expresses them as a percentile in their own respective ranges of values so they can be more directly compared. On that basis we find a number of high 60-percentiles and 70 percentiles, a few that are higher, and not many that are lower.
As to those that are lower, they are mostly good news. The recent price showing is only in about the 50Th percentile of values, a position that is neutral with respect to inflation pressures. The two inventory components show some weak readings indicating that stocks have been cut - a good thing for future production prospects. Export orders are and have been strong but prospects (oddly, given the weak dollar) are somewhat lower as a percentile reading…
As for the key readings…we find production is strong in the current month in the 77th percentile - a bit higher than its outlook, which is only in the 60th percentile. Shipments are firm in the high 70th percentile across categories. The volume of news orders is only in the mid 60th percentile as are new and past order trends – that’s only 10 percentage points above what has been average. Order backlogs are moderate, in their mid 60th percentile.
ON BALANCE… The KC survey looks much better than those from ‘out East.’ The various readings look firm to strong with most key readings above their respective mid point readings. The outlook index is quite solid. The one thing I wonder about is the weaker export readings. The world economy is supposed to be doing better. Why is the export outlook below the 50Th percentile?
| Current Readings | Percent of Own Range | |||||
| Kansas City Component | M/M | 6-Mo Outlook | Yr/Yr | M/M | 6-Mo Outlook | Yr/Yr |
| FAO Indices for Kansas City | 15 | 29 | 27 | 79.6% | 71.5% | 81.5% |
| Production | 26 | 41 | 28 | 77.1% | 60.5% | 70.3% |
| Volume of shipments | 25 | 42 | 33 | 78.1% | 78.1% | 76.7% |
| Volume of new orders | 23 | 40 | 33 | 59.5% | 77.5% | 76.4% |
| Backlog of orders | 10 | 19 | 16 | 65.9% | 63.3% | 65.6% |
| Number of employees | 11 | 22 | 27 | 70.5% | 66.7% | 90.0% |
| Average employee workweek | 3 | 13 | 14 | 36.7% | 68.4% | 67.6% |
| Prices received | 6 | 33 | 60 | 50.0% | 84.4% | 93.1% |
| Prices paid for raw goods | 36 | 54 | 81 | 51.7% | 72.2% | 94.7% |
| Capital expenditures | -- | 22 | 27 | -- | 68.6% | 89.0% |
| New orders for exports | 6 | 7 | 13 | 80.0% | 40.9% | 85.2% |
| Supplier delivery time | 5 | 2 | 5 | 25.0% | 29.2% | 33.3% |
| Inventories: Materials | 3 | -15 | 4 | 68.1% | 3.2% | 50.8% |
| Inventories: Finished goods | -1 | -5 | 0 | 39.3% | 32.0% | 40.0% |

Robert Brusca
AuthorMore in Author Profile »Robert A. Brusca is Chief Economist of Fact and Opinion Economics, a consulting firm he founded in Manhattan. He has been an economist on Wall Street for over 25 years. He has visited central banking and large institutional clients in over 30 countries in his career as an economist. Mr. Brusca was a Divisional Research Chief at the Federal Reserve Bank of NY (Chief of the International Financial markets Division), a Fed Watcher at Irving Trust and Chief Economist at Nikko Securities International. He is widely quoted and appears in various media. Mr. Brusca holds an MA and Ph.D. in economics from Michigan State University and a BA in Economics from the University of Michigan. His research pursues his strong interests in non aligned policy economics as well as international economics. FAO Economics’ research targets investors to assist them in making better investment decisions in stocks, bonds and in a variety of international assets. The company does not manage money and has no conflicts in giving economic advice.
More Economy in Brief


