 Global| Jul 06 2007
June Payrolls Beat Forecasts. Prior Months Revised Up
by:Tom Moeller
|in:Economy in Brief
Summary
Nonfarm payrolls grew by 132,000 during June, an increase that slightly beat the Consensus forecast for a 125,000 rise. In addition, the prior two months' gains were upwardly revised by a collective 75,000. The unemployment rate held [...]
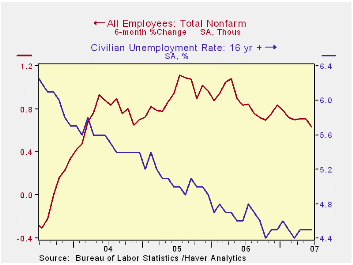
Nonfarm payrolls grew by 132,000 during June, an increase that slightly beat the Consensus forecast for a 125,000 rise. In addition, the prior two months' gains were upwardly revised by a collective 75,000.
The unemployment rate held steady last month at 4.5%. Household employment increased 197,000 (1.2%) following a 157,000 gain in May. The labor force jumped 310,000 (1.1% y/y), the largest gain this year. As a result, the labor force participation rate rose to 66.6%. 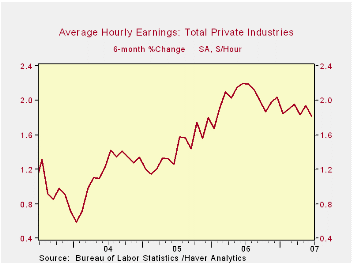
From the establishment survey, the job gain of 132,000 left the average gain in payrolls this year at 145,000 versus last year’s average of 189,000. Private service sector jobs rose just 95,000 (2.0% y/y), versus last year’s average gain of 154,000. Retail employment actually fell 24,200 (0.5% y/y) during June and the average this year has been a meager 7,000 per month after an outright decline of 2,000 per month during 2006. In the financial sector jobs grew just 1,000 (1.4% y/y) for an average 5,000 this year versus 16,000 last year. Professional & business services employment fell 9,000 and the average monthly gain this year has been 13,000, about a quarter of last year’s 42,000.
Factory sector payrolls fell again, by 18,000 (-1.3 y/y) but construction employment rose by 12,000 (-0.1% y/y). The average, though, during this year is a 1,000 per month decline versus an average 11,000 increase per month gain in 2006.
Government payrolls increased 40,000 (1.5% y/y) and in 2007 have risen an average 30,000, up from the per month average last year of 20,000.
Average hourly earnings increased 0.3% as factory sector earnings rose 0.2% (2.7% y/y and private service producing earnings rose a firm 0.4% (4.0% y/y). The monthly average increase in overall average hourly earnings this year has been 0.3% versus, down from 0.4% per month last year.
Inflation and Unemployment: A Layperson’s Guide to the Phillips Curve from the Federal Reserve Bank of Richmond is available here.
| Employment | June | May | Y/Y | 2006 | 2005 | 2004 |
|---|---|---|---|---|---|---|
| Payroll Employment | 132,000 | 190,000 | 1.5% | 1.9% | 1.7% | 1.1% |
| Manufacturing | -18,000 | -7,000 | -1.3% | -0.2% | -0.6% | -1.3% |
| Average Weekly Hours | 33.9 | 33.8 | 33.9 (June '06) | 33.8 | 33.8 | 33.7 |
| Average Hourly Earnings | 0.3% | 0.4% | 3.9% | 3.9% | 2.8% | 2.1% |
| Unemployment Rate | 4.5% | 4.5% | 4.6% (June '06) | 4.6% | 5.1% | 5.5% |
by Robert Brusca OECD LEIs (Trend restored leading indicators) July 6, 2007
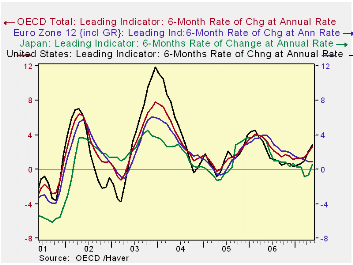
The OECD prefers the six month measures to evaluate the signals from its LEIs. Their six month growth rates are plotted in the chart. After a long period of decline in these indicators’ growth, that peaked in Feb 2006 for the US and May 2006 for the Euro-Zone, the US, OECD and Japan indicators are turning higher. Euro-zone trends are still in a downswing but are flattening out and still growing, albeit slowly. The US is showing a potentially strong upswing in the making, but well below the ’04, ’02 and even ’06 pushes, at least so far.
The table below shows growth readings by area on various progressions. The OECD’s preferred six month horizons are in the bottom of that table and it still shows the European growths rates as descending. All other regions hit their 6-mo growth rate low in the previous six month period and in the recent period ended in May they are in an upswing. Three-month growth rates show that Europe has flattened out as its three month and six month rates are identical at 0.7% Japan which has tuned up in six month terms is still weakening in three months compared to six months. The US is, of course, leading the way higher.
| Growth progression-SAAR | 3-Mos | 6-Mos | 12-Mos | Yr-Ago |
| OECD | 4.0% | 2.7% | 1.8% | 3.5% |
| OECD 7 | 3.5% | 1.9% | 1.0% | 3.2% |
| OECD Europe | 0.7% | 0.7% | 0.9% | 2.7% |
| OECD Japan | 0.5% | 0.6% | 0.0% | 5.9% |
| OECD US | 5.2% | 3.0% | 1.8% | 3.4% |
| Six month readings at 6-Mo Intervals: | ||||
| Recent six | 6-Mos Ago | 12-Mos Ago | 18-Mos Ago | |
| OECD | 2.7% | 1.0% | 3.5% | 3.4% |
| OECD 7 | 1.9% | 0.1% | 2.6% | 3.8% |
| OECD Europe | 0.7% | 1.2% | 3.5% | 1.9% |
| OECD Japan | 0.6% | -0.6% | 2.9% | 9.0% |
| OECD US | 3.0% | 0.6% | 2.5% | 4.3% |
| Slowdowns indicated by BOLD RED | ||||
by Carol Stone July 6, 2007
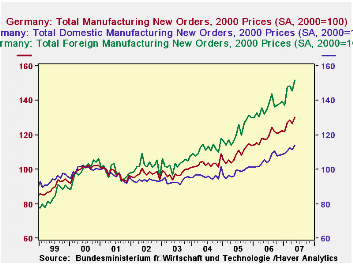
Sometimes it's easy to dismiss manufacturing activity in the West. Asian producers have come on so strong in the last several years that one might think European and North American manufacturing is fading away. But this is not so. Activity in the US has slowed the last several months, but new orders are still maintaining better than 5% annual growth over the past five years in nominal terms. In Europe, a volume measure published by Eurostat is rising at a similar pace. 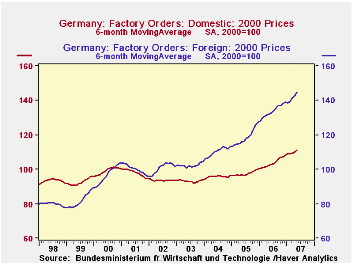
The most recent evidence of continued industrial vitality in the West comes from Germany, where new factory orders surged in May by 3.2%. This more than reversed a dip in April of 1.6%. These orders stand 7.5% ahead of a year ago, on top of last year's overall growth of 9.0%. Foreign customers are increasing their demand for German products, particularly those outside the Euro-Zone. Total foreign orders were up 4.4% in May, with gains among Euro partners of 3.6% and 5.1% elsewhere. Domestic orders were up 2.2% in the latest month.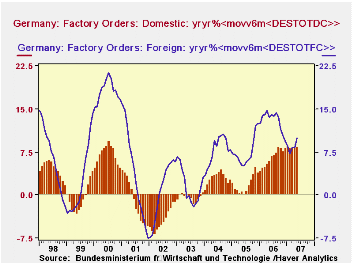
Year-ago comparisons suggest that growth in foreign orders is far outstripping that in domestic orders. The latter are up just 3.8% from May 2006, while orders from Euro-Zone customers are up 9.6% and from non-Euro-Zone, 12.4%. But what these figures really show is volatility. To smooth some of this out, we can examine the performance of moving averages. With the new, oncoming DLXVG3, we can perform nested-function calculations, so we can take a moving average and then do a percent change on the smoothed series. We illustrate that in the second and third graphs, with, first the 6-month moving averages and then the 12-month growth in those moving averages. We see that domestic orders have accelerated to over 8% on this basis, catching up to growth in foreign orders. The last time domestic orders were this strong was in 2000, just at the peak of the tech boom.
At the same time, the continuin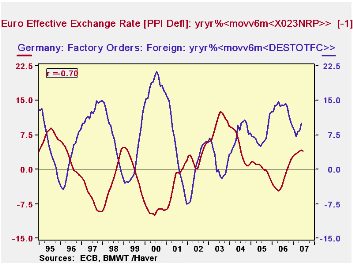 g strength in foreign orders, particularly those outside the Euro-Zone, seems surprising in view of the recent strengthening of the euro. So we looked at this relationship too, with the same year-to-year % change in the 6-month moving average. We find a rather nice, negative relationship with the effective euro exchange rate for the so-called "narrow" group of countries, deflated by the PPIs, which we assume would be a relevant price index for judging the competitiveness of manufacturers. The correlation ratio is -68%. We can improve that slightly, to -70%, by leading the exchange rate variable by 1 month, so that as customers examine their situation, the current exchange rate may have a modest impact on action they take the following month. We see here that the recent experience of orders gains is not really out of line with the exchange rate: as our exchange rate growth variable has started to flatten, orders growth has started to pick up, maintaining the negative reaction. The relationship is in the growth rates, not just the levels.
The German orders data are contained in the main country-source database GERMANY and also in Haver's own G10. US orders data were referenced from USECON and the European totals and exchange rate are from EUROSTAT.
| GERMANY: Manufacturers' New Orders |
May 2007* | Apr 2007* | Mar 2007* | Year Ago | 2006 | 2005 | 2004 |
|---|---|---|---|---|---|---|---|
| Total (2000=100) | 130.6 | 126.5 | 128.5 | 117.4* | 119.0 | 109.1 | 104.1 |
| % Change | 3.2 | -1.6 | 1.1 | 7.5 | 9.0 | 4.9 | 6.8 |
| Domestic | 2.2 | -1.2 | 1.9 | 3.8 | 7.0 | 1.6 | 4.3 |
| Euro-Zone | 3.6 | -1.5 | -1.0 | 9.6 | 7.7 | 8.0 | 9.2 |
| Non-Euro-Zone | 5.1 | -2.3 | 1.4 | 12.4 | 13.8 | 8.7 | 9.8 |
| Intermediate Goods | 2.4 | -1.8 | 2.5 | 4.7 | 10.5 | 2.3 | 6.5 |
| Capital Goods | 3.8 | -2.0 | 0.2 | 10.3 | 8.6 | 6.9 | 8.2 |
| Consumer Goods | 4.0 | 1.6 | 0.2 | 4.6 | 4.8 | 4.3 | 1.4 |
| Memo: Euro** | 0.2 | 1.0 | 0.5 | 3.2 | 0.4 | -1.6 | 2.6 |
by Robert Brusca July 6, 2007
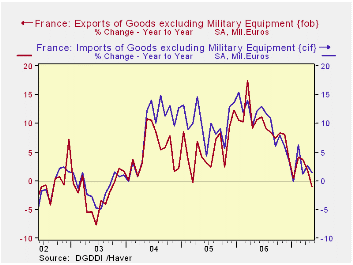
French exports have relatively long lived and broad based declining trends across industries. This is very different from the German results also reported today that showed such strong orders from overseas. While Germany may have special business ties and niches of strength that help to insulate it from the strong euro, France does not seem to be so lucky. While Mr Sarkozy is out there trying to balance one budget (or to postpone putting it in balance) it looks like he has another deficit reading that is ready to split at the seams, this one for trade.
French trends show that despite their proximity and shared currency France and Germany are as different as night and day in some respects. While German order trends for capital goods are very strong, for France actual exports are dropping by 12.3% at an annual rate in the three months ended in May and are lower by 6.3% Yr/Yr. This compares to German foreign order rise of double digits on both those horizons for capital goods. Clearly France is facing a very different situation than Germany. And after also sharing the same business cycle and fiscal issues for a time these two economies are now going their separate ways. Germany has its fiscal situation under control and its MFG sector riding high; and France is trying to postpone its promised adjustment – with the Germans as some of its biggest critics – and its industrial competitiveness seems to be slipping.
It is not as simply as saying there is a capital spending boom in Europe and Germany. If that were so, wouldn’t fellow Euro-zone member France get its share? France is not taking part. Rather Germany, as the most competitive Euro-zone member, is the country that will be the last to feel the effects of the strong euro. German will enjoy a competitive advantage for a while after others have lost it. Is that where we are today? Is that why Germany is still doing well while others are not?
Italy and Spain already are showing some signs of weakness. For Spain it is a clear loss of momentum in industrial output that drops the hint. For Italy weakness is a little more broad-based. The OECD leading indicators still have France on an upswing, but that may be more domestic in nature. France’s external sector seems to be lacking, judging from export trends. Clearly this is a good time to look at the various Euro-zone countries as distinct entities and see which of them –if any- is hurting from the strong Euro. This will be a theme in the coming months.
| m/m% | % SAAR | ||||
| May-07 | Apr-07 | 3M | 6M | 12M | |
| Balance* | -€€ 3,015.00 | -€€ 2,493.00 | -€€ 2,364.33 | -€€ 2,402.33 | -€€ 2,310.42 |
| Exports | |||||
| All Export | -1.0% | -1.4% | -5.5% | -4.0% | -1.0% |
| Capital Goods | -6.5% | 0.6% | -12.3% | -9.6% | -6.3% |
| Motor Vehicles | -2.4% | -1.4% | -13.1% | -6.4% | -5.2% |
| Consumer Goods | -0.2% | -0.6% | -0.4% | -3.7% | 0.4% |
| IMPORTS | |||||
| All Import | -0.6% | 2.0% | -2.4% | 0.5% | 1.4% |
| Capital Goods | 0.6% | -0.1% | -16.7% | 1.0% | -2.6% |
| Motor Vehicles | -0.1% | -1.4% | -4.2% | 9.1% | 3.7% |
| Consumer Goods | -0.2% | -0.2% | -3.2% | -4.1% | 2.6% |
| *Eur Blns; mo or period average | |||||

Tom Moeller
AuthorMore in Author Profile »Prior to joining Haver Analytics in 2000, Mr. Moeller worked as the Economist at Chancellor Capital Management from 1985 to 1999. There, he developed comprehensive economic forecasts and interpreted economic data for equity and fixed income portfolio managers. Also at Chancellor, Mr. Moeller worked as an equity analyst and was responsible for researching and rating companies in the economically sensitive automobile and housing industries for investment in Chancellor’s equity portfolio. Prior to joining Chancellor, Mr. Moeller was an Economist at Citibank from 1979 to 1984. He also analyzed pricing behavior in the metals industry for the Council on Wage and Price Stability in Washington, D.C. In 1999, Mr. Moeller received the award for most accurate forecast from the Forecasters' Club of New York. From 1990 to 1992 he was President of the New York Association for Business Economists. Mr. Moeller earned an M.B.A. in Finance from Fordham University, where he graduated in 1987. He holds a Bachelor of Arts in Economics from George Washington University.
More Economy in Brief


