 Global| Apr 14 2005
JOLTS: U.S. Job Openings Steady
by:Tom Moeller
|in:Economy in Brief
Summary
The Job Openings & Labor Turnover Survey (JOLTS) from the Bureau of Labor Statistics indicated the job openings rate held steady in February at 2.5% versus the revised January level. Both figures remained down slightly from the [...]
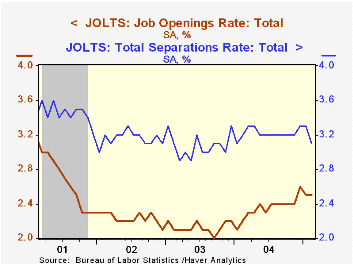
The Job Openings & Labor Turnover Survey (JOLTS) from the Bureau of Labor Statistics indicated the job openings rate held steady in February at 2.5% versus the revised January level. Both figures remained down slightly from the improved level of 2.6% in December. The job openings rate is the number of job openings on the last business day of the month as a percent of total employment plus job openings.
The hires rate in February slipped back to 3.5% from the upwardly revised January level. The hires rate is the number of hires during the month divided by employment.
The total number of job openings rose 2.2% (+16.8% y/y) following the 3.5% decline in January that was more moderate than reported initially.
Job separations fell 4.5% m/m (-0.9% y/y) for the second consecutive monthly decline. The separation rate fell to 3.1%, the lowest in over a year. Total separations include quits, layoffs, discharges, and other separations as well as retirements. The total separations, or turnover, rate is the total number of separations during the month divided by employment.
The survey dates only to December 2000 but has since followed the movement in nonfarm payrolls.
A description of the Jolts survey and the latest release from the U.S. Department of Labor is available here.
| JOLTS (Job Openings & Labor Turnover Survey) | Feb | Jan | Feb '04 | 2004 | 2003 | 2002 |
|---|---|---|---|---|---|---|
| Job Openings Rate: Total | 2.5% | 2.5% | 2.2% | 2.4% | 2.1% | 2.2% |
| Hires Rate: Total | 3.5% | 3.6% | 3.2% | 3.4% | 3.2% | 3.2% |
by Tom Moeller April 14, 2005
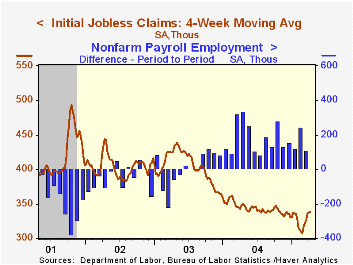
Initial claims for unemployment insurance fell last week by 10,000 to 330,000 versus an upwardly revised level the prior week. Consensus expectations had been for 330,000 claims.
During the last ten years there has been a (negative) 74% correlation between the level of initial claims for unemployment insurance and the monthly change in payroll employment. There has been a (negative) 66% correlation with the level of continuing claims.
The four week moving average of initial claims rose very slightly to 338,000 (-1.7% y/y).
Continuing claims for unemployment insurance fell 22,000 following the 88,000 rise the prior week that was little revised.
The insured unemployment rate remained at 2.1%.
| Unemployment Insurance (000s) | 04/09/05 | 04/02/05 | Y/Y | 2004 | 2003 | 2002 |
|---|---|---|---|---|---|---|
| Initial Claims | 330 | 340 | -7.6% | 343 | 402 | 404 |
| Continuing Claims | -- | 2,664 | -10.9% | 2,926 | 3,531 | 3,570 |
by Tom Moeller April 14, 2005
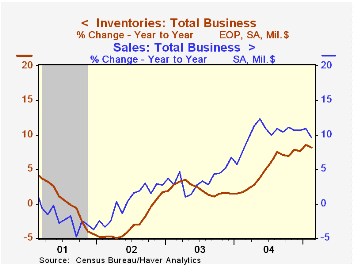
Total business inventories rose another 0.5% in February but figures back to 2002 were revised somewhat lower. Nevertheless, the y/y rate of inventory accumulation continued strong at 8.2% yet still lagged the improvement in sales growth. In February the ratio of inventories-to-sales rose slightly from the record low but remained below the year ago level.
Retail inventories rose 0.3% in February for the second month. Excluding autos, retail inventories moderated to the weakest gain in four months. Inventories of furniture & electronics (+7.1% y/y) fell for the second month and general merchandise inventories rose just 0.1% (5.9% y/y). Apparel inventories accumulated strongly (4.0% y/y) for the second month.
Factory sector inventories grew 0.5% following the 1.5% jump in January. Regardless, the 8.6% gain versus last year was the strongest since 1989.
Wholesale inventory accumulation moderated to a 0.6% gain but the double digit rise versus last year was the strongest since 1995. During the last ten years there has been a 64% correlation between the y/y change in wholesale inventories and the change in imports of merchandise.
Overall business sales fell 0.4% (+9.6% y/y) due to lower wholesale sales and a 0.9% decline in factory shipments.
| Business Inventories | Feb | Jan | Y/Y | 2004 | 2003 | 2002 |
|---|---|---|---|---|---|---|
| Total | 0.5% | 0.9% | 8.2% | 7.7% | 1.4% | 1.6% |
| Retail | 0.3% | 0.3% | 5.6% | 5.7% | 3.9% | 5.9% |
| Retail excl. Autos | 0.4% | 0.7% | 6.9% | 5.9% | 2.0% | 2.3% |
| Wholesale | 0.6% | 1.0% | 11.1% | 10.8% | 2.0% | 1.2% |
| Manufacturing | 0.5% | 1.5% | 8.6% | 7.5% | -1.3% | -1.8% |
by Carol Stone April 14, 2005
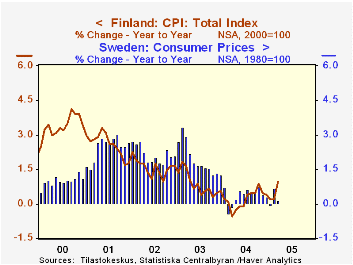
A couple of weeks ago, we noted here that higher energy prices had failed to ignite new inflation in Italy. The same is true for some other countries, whose CPI data were reported today for March. In Poland, the seasonally adjusted CPI was absolutely flat for a second month, and the year/year increase eased to 3.4% from 3.6% in February. In Finland, the year/year pace did go up in March to 1.0%, from 0.2% in both January and February, but this remains a relatively low number. Finnish inflation has averaged 1.3% over the last five years.
In Sweden, there is almost no inflation at all, nor any sign of a pickup. The March figure was a mere 0.1% above March 2004, with the prior two months averaging a little over 0.3%, about the same as in 2004 overall.
Thus, as in the situation in Italy, which we discussed before, other prices remain weak, offsetting the pressure from energy. Clothing prices and technology-driven communications costs are low in most countries. Even fuel components themselves have slowed from their strongest pace, as seen in the second graph.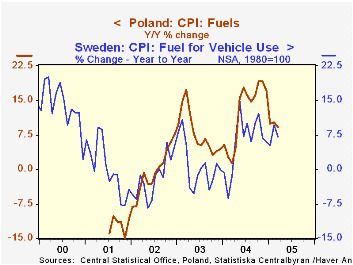
We speak of the restrained inflation as beneficial for these economies, but that remains, of course, a relative statement. As prices are held back in the face of rising fuel costs, someone's profits or incomes are being squeezed, so the outlook is still clouded by high-priced energy.
| Yr/Yr % Changes Not Seasonally Adjusted |
Mar 2005 | Feb 2005 | Jan 2005 | December/December|||
|---|---|---|---|---|---|---|
| 2004 | 2003 | 2002 | ||||
| Poland | 3.4 | 3.6 | 3.6 | 4.4 | 1.7 | 0.7 |
| Sweden | 0.1 | 0.7 | 0.0 | 0.3 | 1.3 | 2.1 |
| Finland | 1.0 | 0.2 | 0.2 | 0.4 | 0.6 | 1.7 |
| Italy | 1.9 | 1.9 | 1.9 | 2.0 | 2.5 | 2.8 |
| US | -- | 3.0 | 3.0 | 3.3 | 1.9 | 2.4 |

Tom Moeller
AuthorMore in Author Profile »Prior to joining Haver Analytics in 2000, Mr. Moeller worked as the Economist at Chancellor Capital Management from 1985 to 1999. There, he developed comprehensive economic forecasts and interpreted economic data for equity and fixed income portfolio managers. Also at Chancellor, Mr. Moeller worked as an equity analyst and was responsible for researching and rating companies in the economically sensitive automobile and housing industries for investment in Chancellor’s equity portfolio. Prior to joining Chancellor, Mr. Moeller was an Economist at Citibank from 1979 to 1984. He also analyzed pricing behavior in the metals industry for the Council on Wage and Price Stability in Washington, D.C. In 1999, Mr. Moeller received the award for most accurate forecast from the Forecasters' Club of New York. From 1990 to 1992 he was President of the New York Association for Business Economists. Mr. Moeller earned an M.B.A. in Finance from Fordham University, where he graduated in 1987. He holds a Bachelor of Arts in Economics from George Washington University.
More Economy in Brief


