 Global| Jan 13 2010
JOLTS: U.S. Job Openings Remain AtSeries' Low
by:Tom Moeller
|in:Economy in Brief
Summary
The Bureau of Labor Statistics continued to indicate little improvement in hiring, but layoffs have diminished. In its Job Openings & Labor Turnover Survey (JOLTS) job availability during November fell 6.1% from October and is off [...]
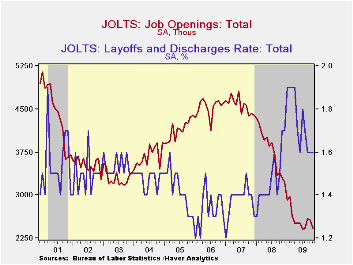 The
Bureau
of Labor Statistics continued to indicate little improvement in hiring,
but layoffs have diminished. In its Job Openings & Labor
Turnover Survey (JOLTS) job availability during November fell 6.1% from
October and is off 27.1% year-to-year. The series dates back to
December 2000. As a result of the decline the job
openings rate fell to 1.8% and remained off sharply from the
3.1% rate before the current recession began. The job
openings rate is the number of job openings on the last business day of
the month as a percent of total employment plus job openings.
The
Bureau
of Labor Statistics continued to indicate little improvement in hiring,
but layoffs have diminished. In its Job Openings & Labor
Turnover Survey (JOLTS) job availability during November fell 6.1% from
October and is off 27.1% year-to-year. The series dates back to
December 2000. As a result of the decline the job
openings rate fell to 1.8% and remained off sharply from the
3.1% rate before the current recession began. The job
openings rate is the number of job openings on the last business day of
the month as a percent of total employment plus job openings.
The service sector weakened last month. The number of retail
job
openings fell 15.8% (-49.3% y/y) and the number of professional
& business service jobs fell 9.2% (-13.7% y/y). Leisure
& hospitality jobs also were off, by 7.8% (-21.2% y/y), but
educational & health service jobs rose 4.2% (-21.7% y/y). Even
the number of government sector job openings fell 9.8% (-10.3% y/y).
Countering weakness in service sector hiring was the factory sector
where job openings rose for the fourth consecutive month but they remained off 28.6% y/y.
 Construction
sector job openings were firm for the third of the last four months and
posted an 11.6% (+1.3% y/y) increase.
Construction
sector job openings were firm for the third of the last four months and
posted an 11.6% (+1.3% y/y) increase.
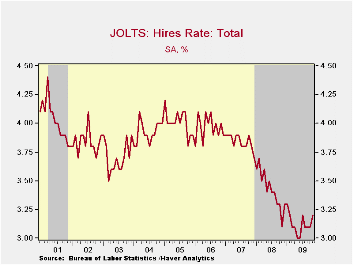
The hires rate picked up slightly m/m to 3.2% and was improved from the series' low of 3.0% last spring. The hires rate is the number of hires during the month divided by employment. The actual number of hires also rose 3.2% m/m but was down 1.2% year-to-year. Professional & business service sector hires rose 14.1% (7.2% y/y) while leisure & hospitality hires rose 8.4% (4.0% y/y). Factory sector hiring slipped 0.8% and was off a diminished 5.4% y/y while construction sector hiring also dipped m/m (-10.0% y/y).
The job separations rate increased modestly from the series' low to 3.3% with the actual number of separations off 10.8% year-to-year. Separations include quits, layoffs, discharges, and other separations as well as retirements. The layoff rate alone held steady at 1.6% for the third consecutive month. That was down sharply from the rate's high of 1.9% last winter.
The JOLTS survey dates only to December 2000 but has followed the movement in nonfarm payrolls, though the actual correlation between the two series is low.
A description of the Jolts survey and the latest release from the U.S. Department of Labor is available here and the figures are available in Haver's USECON database.
| JOLTS (Job Openings & Labor Turnover Survey) | November | October | September | Nov. '08 | 2008 | 2007 | 2006 |
|---|---|---|---|---|---|---|---|
| Job Openings, Total | |||||||
| Rate (%) | 1.8 | 1.9 | 1.9 | 2.4 | 2.3 | 3.1 | 3.3 |
| Total (000s) | 2,415 | 2,571 | 2,586 | 3,311 | 3,224 | 4,382 | 4,606 |
| Hires, Total | |||||||
| Rate (%) | 3.2 | 3.1 | 3.1 | 3.1 | 41.1 | 46.1 | 47.6 |
| Total (000s) | 4,176 | 4,045 | 4,061 | 4,226 | 56,486 | 63,666 | 64,879 |
| Layoffs & Discharges, Total | |||||||
| Rate (%) | 1.6 | 1.6 | 1.6 | 1.7 | 1.5 | 1.4 | 1.3 |
| Total (000s) | 2,054 | 2,128 | 2,128 | 2,253 | 24,362 | 22,613 | 21,546 |
by Tom Moeller January 13, 2010
 Earlier
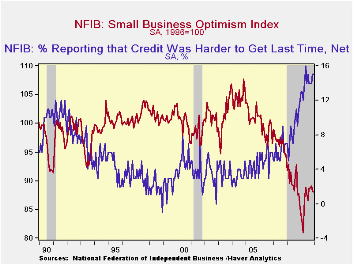
improvement in small business' optimism slipped again last month. The
National Federation of Independent Business (NFIB) reported their
December small business optimism index dipped 0.3% to 88.0. This second
consecutive slight decline followed several months of increase after
reaching a March low of 81.0. During the last ten years, there
has been an 85% correlation between the level of the NFIB index and the
two-quarter change in real GDP.
Earlier
improvement in small business' optimism slipped again last month. The
National Federation of Independent Business (NFIB) reported their
December small business optimism index dipped 0.3% to 88.0. This second
consecutive slight decline followed several months of increase after
reaching a March low of 81.0. During the last ten years, there
has been an 85% correlation between the level of the NFIB index and the
two-quarter change in real GDP.
Credit conditions remained as tight as they've been since the "credit crunch" recession of 1980. The percentage of firms reporting that credit was harder to get was stable m/m at a net 15 but that was roughly triple the percentage from 1994 to 2007. The percent borrowing at least once last quarter was stable at 33% but that was down from the high of 46% during 2006.
The percentage
of small businesses expecting the economy to improve dipped slightly
m/m to 2 after a sharp November decline. The latest was down from the
May high of 12. 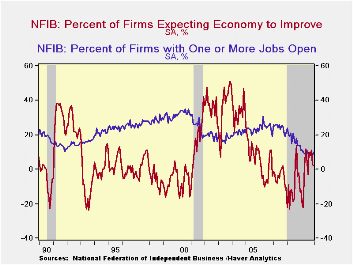 The percentage which thought that now was a good time
to expand the business also slipped to 7 though it remained sharply
improved from this winter.
The percentage which thought that now was a good time
to expand the business also slipped to 7 though it remained sharply
improved from this winter.
Hiring intentions have responded negatively to recent weakness in overall business sentiment. The percentage of firms planning to raise employment remained in a net-layoff region, though it has improved from the March low. For now, the percentage of firms with one or more job openings improved modestly to 10% during December. During the last ten years there has been a 74% correlation between the NFIB employment percentage and the six-month change in nonfarm payrolls. Also stable in the negative region was the percentage expecting credit conditions to ease.
On the pricing front deflation
continued. The percentage of firms actually raising
prices at -22% (indicating deflation) slipped from the prior several
months and was near the record low. During the last ten years there has
been a 60% correlation between the six-month change in the producer
price index and the level of the NFIB price index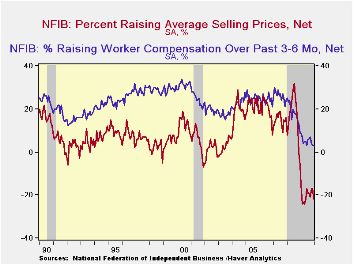
The percentage of firms planning to raise prices slipped again to a net 3 though that remained up from the March low of zero. Finally, the percentage planning to raise worker compensation fell to 1.
The largest, single most important problems seen by business were poor sales (34%), taxes (20%, near its highest level since 2007), government requirements (13%), insurance cost & availability (7%), competition from large businesses (6%) and inflation (2%).
About 24 million small businesses exist in the United States. Small business creates 80% of all new jobs in America and the NFIB figures can be found in Haver's SURVEYS database.
| Nat'l Federation of Independent Business | December | November | October | Y/Y | 2009 | 2008 | 2007 |
|---|---|---|---|---|---|---|---|
| Small Business Optimism Index (SA, 1986=100) | 88.0 | 88.3 | 89.1 | 3.3% | 86.7 | 89.8 | 96.7 |
| Percent of Firms Expecting Economy To Improve | 2 | 3 | 11 | -13 | -0 | -10 | -4 |
| Percent of Firms With One or More Job Openings | 10 | 8 | 8 | 14 | 9 | 18 | 24 |
| Percent of Firms Reporting That Credit Was Harder To Get | 15 | 15 | 14 | 12 | 14 | 9 | 6 |
| Percent of Firms Raising Avg. Selling Pric1es (Net) | -22 | -17 | -17 | -6 | -20 | 17 | 15 |
by Robert Brusca January 13, 2010
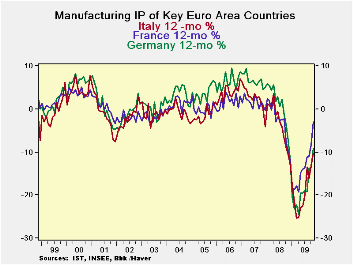
Europe’s recovery remains on track in November as industrial production has risen in all the large EMU states. The UK, an EU member, only saw a very minor set back to MFG IP with output dropping by 0.1% in November. Of the largest EMU states, the rise in the Italy was disappointing at just 0.2%. The UK’s small drop actually out did expectations.
Year-over-year the IP drops have been trimmed to the range of -4% to -10% for this group of countries. Despite the set back to UK IP in November at -5.4% it demonstrates one of the smaller Yr/Yr drops in IP and exhibits a strong improvement from its result in October (-7.8%, Yr/Yr). All large countries show an improvement in their Yr/Yr drop in November compared to October and for most the difference is large.
The chart above shows how strong the recoveries have been. Despite all that strength over the last 3- and 6-months, 2009 has been a very bad year for Europe.
German GDP is just reported to have posted an outsized drop of 5% in 2009 as its exports and investment goods sectors were hard hit. As it was, government programs produced a boost that kept the steep GDP decline from being even larger. Public consumption rose by 2.7% from 2008 while private consumption edged ahead by just 0.2%.
The recovery in IP is however a good development. Germany’s industrial sector depends on exports which fell by 14.7% in 2009. Exports have begun to get traction again and IP is on the rise as a result. 2010 promises to be a much better year, but then 2009 put all of Europe in a very deep hole and the real question is not 'Will 2010 be better?' but, 'How much better will 2010 be?' That is not yet resolved and is a point of some contention. So far, good strong growth is in train and seems to have staying power. Perhaps more optimism is warranted.
| Main Euro-Area Countries and UK IP in MFG | ||||||||||
|---|---|---|---|---|---|---|---|---|---|---|
| Mo/Mo | Nov 09 |
Oct 09 |
Nov 09 |
Oct 09 |
Nov 09 |
Oct 09 |
||||
| MFG Only | Nov 09 |
Oct 09 |
Sep 09 |
3Mo | 3Mo | 6mo | 6mo | 12mo | 12mo | Q:4 Date |
| Germany: | 0.8% | -1.8% | 3.6% | 10.6% | 16.6% | 9.1% | 18.6% | -9.1% | -13.7% | 8.0% |
| France: IPxConstruct'n |
1.1% | -0.6% | -1.2% | -2.6% | 4.2% | 6.1% | 8.6% | -3.8% | -8.0% | 0.5% |
| Italy | 0.2% | 1.0% | -5.2% | -15.3% | 6.4% | 7.0% | 5.9% | -10.2% | -13.2% | -2.6% |
| Spain | 1.2% | -3.0% | 0.5% | -5.5% | -20.2% | 17.9% | -0.2% | -3.9% | -13.0% | -14.2% |
| UK: EU member | -0.1% | 0.0% | 1.6% | 6.1% | -1.8% | 0.9% | -0.4% | -5.4% | -7.8% | 1.6% |

Tom Moeller
AuthorMore in Author Profile »Prior to joining Haver Analytics in 2000, Mr. Moeller worked as the Economist at Chancellor Capital Management from 1985 to 1999. There, he developed comprehensive economic forecasts and interpreted economic data for equity and fixed income portfolio managers. Also at Chancellor, Mr. Moeller worked as an equity analyst and was responsible for researching and rating companies in the economically sensitive automobile and housing industries for investment in Chancellor’s equity portfolio. Prior to joining Chancellor, Mr. Moeller was an Economist at Citibank from 1979 to 1984. He also analyzed pricing behavior in the metals industry for the Council on Wage and Price Stability in Washington, D.C. In 1999, Mr. Moeller received the award for most accurate forecast from the Forecasters' Club of New York. From 1990 to 1992 he was President of the New York Association for Business Economists. Mr. Moeller earned an M.B.A. in Finance from Fordham University, where he graduated in 1987. He holds a Bachelor of Arts in Economics from George Washington University.
More Economy in Brief


