 Global| Apr 11 2007
JOLTS Report Shows U.S. Economy’s Complexities
Summary
Frances trade deficit widened in February as imports outpaced exports. Import growth continues to look more vibrant than export growth as the trends are accelerating more uniformly across trade categories. Over the recent three [...]
| The JOLTS report (Job Openings and Labor Turnover Survey) is not a front-line jobs report but it is a report economists like that reveals a lot about what is going on behind the scenes in the labor market. This month’s report is mixed as it shows a slowing in hires and in openings but fewer separations and a steady quit rate with lower layoff tendencies. At the bottom of the table below I try to bring theses reading to life by placing them in their respective ranges and defining each as being in a set percent of its range. There I also present the current readings expressed as percentages of their own respective means and medians. In that way the relative merit of each category comes through a bit clearer. The table shows that layoffs and separations are quite low. Layoffs are at a series low, in fact. Quits are high. To an economist this a good sign since people do not quit jobs unless prospects are good. A high quit rate is a good sign of labor market strength. Job openings are high and higher in their range than is hiring (hiring is at the two-thirds mark in its range). This configuration makes me wonder about skill mixes and labor shortages. |
|---|
| National Statistics Since January of 2000 | ||||||
| Openings | Hires | Separation | Quit | Layoffs & D | Other Separations | |
| Feb-07 | 3.0 | 3.9 | 3.6 | 2.2 | 1.1 | 0.2 |
| Jan-07 | 3.1 | 4.0 | 3.7 | 2.2 | 1.5 | 0.3 |
| average | 2.6 | 3.8 | 3.7 | 2.0 | 1.4 | 0.2 |
| Median | 2.6 | 3.8 | 3.7 | 2.0 | 1.4 | 0.2 |
| Percentile | 75.0% | 66.7% | 37.5% | 83.3% | 0.0% | 0.0% |
| Range | 1.2 | 0.9 | 0.8 | 0.6 | 0.7 | 0.1 |
| Max | 3.3 | 4.2 | 4.1 | 2.3 | 1.8 | 0.3 |
| Min | 2.1 | 3.3 | 3.3 | 1.7 | 1.1 | 0.2 |
| Percent of | ||||||
| Median | 117.6% | 102.6% | 97.3% | 110.0% | 78.6% | 100.0% |
| Average | 115.9% | 103.4% | 98.0% | 108.1% | 78.2% | 86.8% |
| Recovery period only | ||||||
| Percentile | 75.0% | 66.7% | 37.5% | 83.3% | 0.0% | 0.0% |
| Median | 115.4% | 100.0% | 97.3% | 104.8% | 78.6% | 100.0% |
| Average | 113.5% | 102.2% | 97.9% | 107.7% | 78.6% | 86.4% |
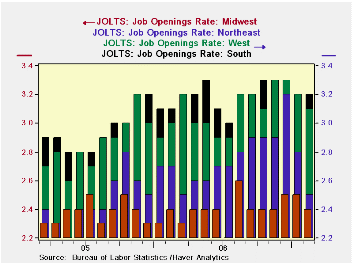
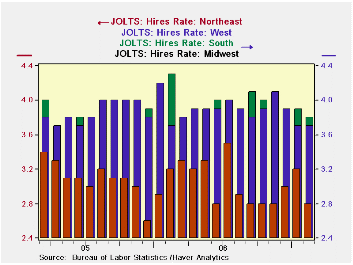
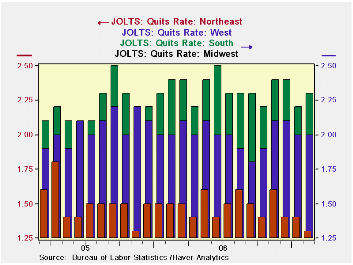
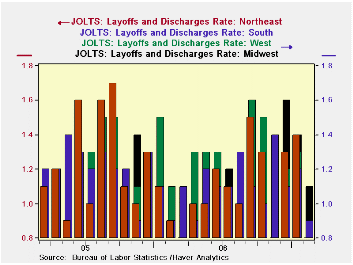
| Regional variances Regionally conditions can be and are quite different. Hiring has been strong in the Midwest, West and South, but it has lagged in the Northeast. Job openings are the highest in the South then the West followed by the Midwest with the Northeast decidedly trailing.But all regions see low layoffs. For three of them layoffs are at a cycle low. For the Midwest they are moderate in the lower one-third of its range. We know that a lot of auto company programs are trying to ease out high cost labor and that these firms concentrate in the Midwest. Still, the Midwest reading is quite moderate. The relatively high quit rates show strong local labor markets from the South across the Midwest to the West. But the Northeast has a low quit rate, a sign of a poor labor market since workers with jobs are reluctant to leave them. |
|---|
    |
| JOLTS by Industry We can weight and array JOLTS data by industry. On this basis some odd things emerge as well as some very understandable ones. The construction sector is clearly under some pressure. Yet, the JOLTS figures show that job openings in the sector are at a recovery period high. At the same time, separations, quits and hires in the sector are at or nearly at recovery period lows. This raises some questions about what the job openings are - for what kinds of jobs and what pay. Hires are the relative strongest for Government, followed by other services. Manufacturing sector hires are above the midpoint, in their 60th percentile. Quits are moderate for government and fairly robust for manufacturing and services. On balance the JOLTS data show a still vibrant labor market. The high quit rates are quite indicative of strength and they transcend most regions (except the NE) and industries (except construction). The service sector is a very solid sector. Even manufacturing is far short of being called soft; it looks pretty well-off despite all the industry restructuring. In short the JOLTS report looks behind the scenes of the jobs data and finds that the underpinnings look pretty good. |
|---|
| Major Job Sectors | ||||
| Feb-07 | Services | Manufacturing | Constructions | Government |
| Job Openings | 67.8% | 85.7% | 100.0% | 87.5% |
| Hires | 79.7% | 60.0% | 0.0% | 100.0% |
| Separations | 57.4% | 70.0% | 4.0% | 50.0% |
| Quits | 89.0% | 83.3% | 0.0% | 50.0% |
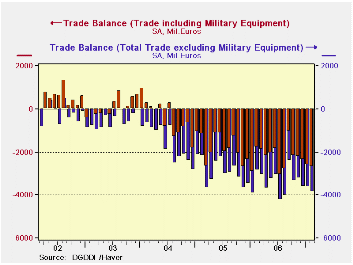
France’s trade deficit widened in February as imports outpaced exports. Import growth continues to look more vibrant than export growth as the trends are accelerating more uniformly across trade categories.
Over the recent three months imports are growing at a pace of 7.5% nearly the same as the Yr/Yr pace. For exports the overall pace for three month is barely positive and well under the Yr/Yr growth rate of 5%. For the rest of imports growth rates are quite solid. For capital goods the pace of acceleration is quite clear with blow-off type growth over the last three months. That pace is sure to cool from the near 40% it currently posts. Motor vehicle imports are strong, running at a super strong 28% pace and 14% Yr/Yr. Other consumer goods however show weakness: imports at -6.4% for three months and they are steadily decelerating.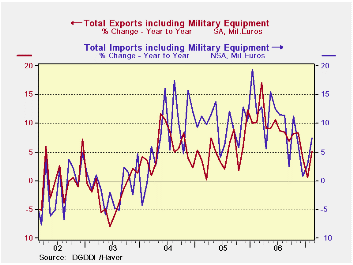
This is the mixed picture for France. Export growth is cooling. Imports are strong and seem to point to strong domestic demand. But consumer goods imports (non-auto) are very weak and do not signal that same type of domestic demand strength form the consumer. For the moment France is a bit enigmatic.
After seeing export and import trends wither steadily throughout 2006 and early 2007 both exports and imports have sprung to life in February of 2007.
| M/M% | % SAAR | ||||
| Feb-07 | Jan-07 | 3M | 6M | 12M | |
| Balance* | -€€ 2,702.00 | -€€ 2,612.00 | -€€ 2,565.67 | -€€ 2,185.83 | -€€ 2,245.17 |
| Exports | |||||
| All Exports | 2.8% | -1.4% | 0.2% | 4.0% | 5.1% |
| Capital Goods | 1.3% | 1.3% | -1.1% | 18.9% | 1.8% |
| Motor Vehicles | 4.8% | 0.7% | 2.8% | -1.8% | 4.7% |
| Consumer Goods | 0.5% | -4.3% | -6.2% | 2.6% | 3.6% |
| IMPORTS | |||||
| All Imports | 3.2% | -1.2% | 7.5% | 2.6% | 7.6% |
| Capital goods | 6.4% | 2.6% | 39.1% | 10.8% | 9.0% |
| Motor Vehicles | 3.0% | 0.8% | 28.2% | 16.8% | 14.0% |
| Consumer goods | 2.0% | -1.9% | -6.4% | 0.5% | 6.2% |
| *Bil. Euros; mo or period average | |||||
by Robert Brusca April 11, 2007
The U.S. federal government ran a deficit of $96.3B during March, well ahead of last March's $85.3B and also larger than consensus forecasts of $89B.
This performance brought the fiscal-year-to-date deficit to $258.4B, down from $302.9B through March last year.
Summary data for the monthly budget, reported in the Monthly Treasury Statement, are available Haver's USECON database. Details are carried in the GOVFIN database.
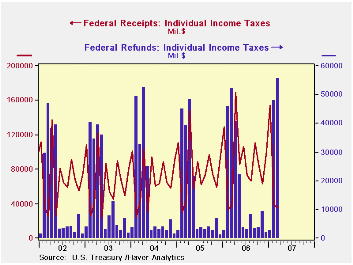
The excess of the monthly deficit over the forecast amount may result from the acceleration into March of April payments for veterans' benefits, supplemental security income and some Medicare outlays; these are ordinarily paid on the first day of each month, but are moved forward when the First falls on a weekend. April outlays will be commensurately reduced. Additionally, individual income tax refunds reached a record for a single month, $55.5B. The previous records were $52.4B in April 2004 and $52.2B in March last year. This is possibly due to earlier filing by taxpayers, and April and May refunds could turn out to be somewhat smaller.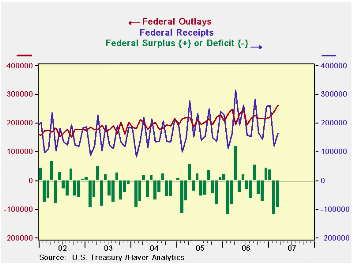
In total, net revenues were $166.5B in March, up just 1.2% from March 2006; for the fiscal-year-to-date, they were 8.0% above the comparable period of fiscal 2006. Individual income tax receipts were $35.4B in March, down 9.8% from March 2006, but fiscal 2007-to-date saw $479.2B, up 10.8%. Corporate income taxes were $40.2B, a record for March and up 11.8% from a year ago. Social insurance taxes were $76.5B in the month, up 6.2% from a year ago.
The U.S. Government's net outlays grew 5.2% from March 2006, reaching $262.8B, with the cumulative total for the first six fiscal months up 2.9%. Defense outlays were $52.0B in the month, up 2.4% on the year earlier. Social security outlays (benefits and administrative costs) were $48.9B, up 5.9%. Net interest turned somewhat higher, reaching $21.1B, up 8.8% on March a year ago, while smaller amounts in previous months put the total for the fiscal year so far up only 2.5%.
This report gives an inconclusive read on the state of the budget, since key tax payments are going on this month and the timing of other tax filing seems to be changing from year to year. Major outlay patterns are also erratic from month to month. Nonetheless, overall, revenues are continuing to grow faster than outlays and the budget deficit is continuing to diminish.
| US Government Budget, Bil.$ | Mar 2007 | Feb 2007 | Oct 2006 Mar 2007 |
Oct 2005 Mar 2006 |
FY 2006 | FY 2005 | FY 2004 |
|---|---|---|---|---|---|---|---|
| Budget Balance | -96.3 | -120.0 | -258.4 | -302.9 | -248.2 | -318.7 | -411.1 |
| Net Revenues | 166.5 | 120.3 | 1120.9 | 1037.6 | 11.8% | 14.6% | 5.4% |
| 8.0% | 10.5% | ||||||
| Net Outlays | 262.8 | 240.3 | 1379.3 | 1340.6 | 7.4% | 7.9% | 6.2% |
| 2.9% | 8.7% |

Robert Brusca
AuthorMore in Author Profile »Robert A. Brusca is Chief Economist of Fact and Opinion Economics, a consulting firm he founded in Manhattan. He has been an economist on Wall Street for over 25 years. He has visited central banking and large institutional clients in over 30 countries in his career as an economist. Mr. Brusca was a Divisional Research Chief at the Federal Reserve Bank of NY (Chief of the International Financial markets Division), a Fed Watcher at Irving Trust and Chief Economist at Nikko Securities International. He is widely quoted and appears in various media. Mr. Brusca holds an MA and Ph.D. in economics from Michigan State University and a BA in Economics from the University of Michigan. His research pursues his strong interests in non aligned policy economics as well as international economics. FAO Economics’ research targets investors to assist them in making better investment decisions in stocks, bonds and in a variety of international assets. The company does not manage money and has no conflicts in giving economic advice.
More Economy in Brief


