 Global| Feb 07 2006
JOLTS: More U.S. Job Openings, Less Hiring?
by:Tom Moeller
|in:Economy in Brief
Summary
The Bureau of Labor Statistics reported that the job openings rate, from the Job Openings & Labor Turnover Survey (JOLTS), rose again in December as the US job market firmed further. The rate rose to 2.9% from 2.8% in November and [...]
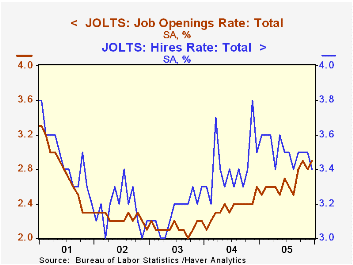
The Bureau of Labor Statistics reported that the job openings rate, from the Job Openings & Labor Turnover Survey (JOLTS), rose again in December as the US job market firmed further. The rate rose to 2.9% from 2.8% in November and averaged 2.7% during the year, an improvement from 2.4% during 2004. The job openings rate is the number of job openings on the last business day of the month as a percent of total employment plus job openings.
The actual number of job openings rose 123,000 (15.5% y/y) to 4.05 million.
Not showing the same improvement, the hires rate slipped in December to 3.4% and fell during much of the year from a 1Q high of 3.6%. The hires rate is the number of hires during the month divided by employment. The hires level during December fell 134,000 (-2.8% y/y) to 4.507 million.
The job separations rate dropped sharply to 3.1%, the lowest level in nearly two years. Separations include quits, layoffs, discharges, and other separations as well as retirements. The total separations, or turnover, rate is the total number of separations during the month divided by employment. The level of job separations fell 182,000 (-6.8% y/y) to 4.133 million.
The survey dates only to December 2000 but has since followed the movement in nonfarm payrolls.
A description of the Jolts survey and the latest release from the U.S. Department of Labor is available here.
| JOLTS (Job Openings & Labor Turnover Survey) | Dec | Nov | Dec '04 | 2005 | 2004 | 2003 |
|---|---|---|---|---|---|---|
| Job Openings Rate: Total | 2.9% | 2.8% | 2.6% | 2.7% | 2.4% | 2.1% |
| Hires Rate: Total | 3.4% | 3.5% | 3.5% | 3.5% | 3.4% | 3.2% |
by Tom Moeller February 7, 2006
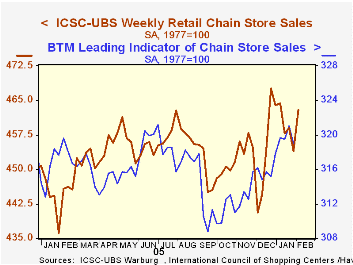
Chain store sales surged 2.0% during the opening week of February and recovered all of the prior week's sharp 1.1% decline, according to the International Council of Shopping Centers (ICSC)-UBS survey.
As a result of the jump, sales began the month 0.9% above the January average which rose 1.0% from December.
The rise in sales may have been aided by a two cent decline in gasoline prices at the pump to $2.34 per gallon of regular unleaded. The decline reversed most of the prior week's rise. Despite the decline, retail gasoline prices began February three cents higher than the January average with rose thirteen cents versus December. 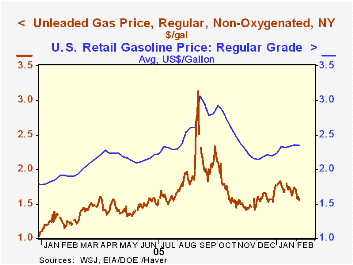
In spot market trading, gasoline prices recently have been quite soft. The decline from $1.74 last Monday extended to yesterday when prices hit $1.56, the lowest level since late December. Weak demand for gasoline may have caused the price weakness as gasoline demand fell 10% from December. Seasonal declines in demand of this order have been common during January in the past. The theory is complicated, however, by the abnormally warm temperatures last month.
The leading indicator of chain store sales reversed all of the prior week's rise and fell 0.6%.The ICSC-UBS retail chain-store sales index is constructed using the same-store sales (stores open for one year) reported by 78 stores of seven retailers: Dayton Hudson, Federated, Kmart, May, J.C. Penney, Sears and Wal-Mart.
| ICSC-UBS (SA, 1977=100) | 02/04/06 | 01/28/06 | Y/Y | 2005 | 2004 | 2003 |
|---|---|---|---|---|---|---|
| Total Weekly Chain Store Sales | 462.9 | 454.0 | 3.8% | 3.6% | 4.7% | 2.9% |
by Louise Curley February 7, 2006
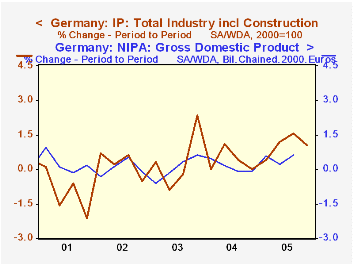
There was more news from Germany that economic activity slowed significantly in the fourth quarter. Declines in December retail sales, new orders and sales in manufacturing and mining have already been reported and today we learn that industrial production fell 0.5% in December from November after having fallen 0.4% in the previous month. Production of intermediate and energy goods increased but were outweighed by declines in the production of capital and consumer goods.The increase in the quarterly average of industrial production for the fourth quarter was 1.05%, a decline from the 1.56% increase of the third quarter. As shown in the first chart the quarter-to-quarter change in industrial production tends to suggest the change in real gross domestic product.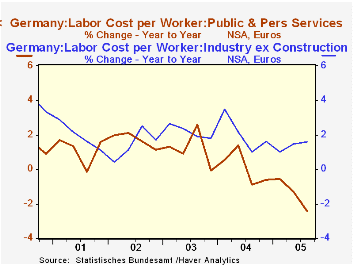
Also in the news were reports of labor unrest in Germany. Ten thousand workers, members of the public service union, Verdi, began a strike in Baden-Wurttember on February 6th. Targeted services include waste disposal, road maintenance, hospitals and kindergartens. The issues are wages and hours. Wages have shown little increase in the past few years and the workers are now being asked to work longer hours at the same pay. The IG Metall engineering union is also stirring. It will start negotiations this week over its demand for a 5% rise for its 3.4 million industrial workers. The second chart shows the year-to-year changes in the compensation of workers in Total Industry ex Construction and in Public and Personal Services. The increases, particularly in the Public and Personal Services have been well below the roughly 2% inflation rate that has prevailed recently. These data, along with data for productivity and unit labor costs are found in Haver's Germany data base. The data are quarterly and were last updated in November 22. Data for the fourth quarter should be available later this month.
| Germany: Industrial Production (2000=100) | Q3 05 | Q2 05 | Q1 05 | Q4 04 | Q3 04 | 2004 | 2003 | 2002 |
|---|---|---|---|---|---|---|---|---|
| Total | 105.1 | 105.6 | 101.6 | -1047 | 3.44 | 103.6 | 100.8 | 98.4 |
| Intermediate products | 110.2 | 109.8 | 104.9 | 0.36 | 5.05 | 106.8 | 103.4 | 99.5 |
| Capital goods | 111.6 | 114.3 | 104.8 | -2.36 | 6.49 | 110.9 | 105.7 | 102.0 |
| Consumer goods | 97.6 | 97.8 | 96.9 | -0.20 | 0.72 | 98.2 | 96.0 | 95.4 |
| Energy | 103.0 | 101.6 | 105.8 | 1.38 | -2.65 | 102.6 | 102.6 | 99.9 |
| Labor Costs Per Employee (euros) | Q3 05 % chg |
Q2 05 % chg |
Q1 05 % chg |
Q4 04 % chg |
Q3 04 % chg |
2004 % chg |
2003 % chg |
2002 % chg |
| Industry ex construction | 1.60 | -0.67 | 1.92 | -1.04 | 0.70 | 0.56 | 2.34 | 2.11 |
| Public and personal services | -1.34 | -0.72 | 1.18 | -1.45 | -1.07 | -.55 | 0.99 | 1.81 |

Tom Moeller
AuthorMore in Author Profile »Prior to joining Haver Analytics in 2000, Mr. Moeller worked as the Economist at Chancellor Capital Management from 1985 to 1999. There, he developed comprehensive economic forecasts and interpreted economic data for equity and fixed income portfolio managers. Also at Chancellor, Mr. Moeller worked as an equity analyst and was responsible for researching and rating companies in the economically sensitive automobile and housing industries for investment in Chancellor’s equity portfolio. Prior to joining Chancellor, Mr. Moeller was an Economist at Citibank from 1979 to 1984. He also analyzed pricing behavior in the metals industry for the Council on Wage and Price Stability in Washington, D.C. In 1999, Mr. Moeller received the award for most accurate forecast from the Forecasters' Club of New York. From 1990 to 1992 he was President of the New York Association for Business Economists. Mr. Moeller earned an M.B.A. in Finance from Fordham University, where he graduated in 1987. He holds a Bachelor of Arts in Economics from George Washington University.
More Economy in Brief


