 Global| Sep 12 2007
JOLTS: Job Openings Unchanged, Hires Rate Improved (Slightly)
by:Tom Moeller
|in:Economy in Brief
Summary
The Bureau of Labor Statistics reported in the Job Openings & Labor Turnover Survey (JOLTS) that the July job openings rate was unchanged from the prior month at 3.0%. Nevertheless, it still was the highest level since January. The [...]
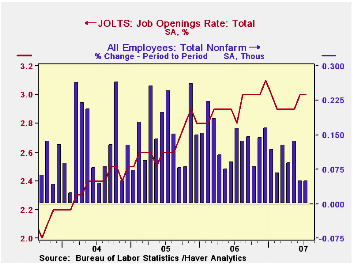
The Bureau of Labor Statistics reported in the Job Openings & Labor Turnover Survey (JOLTS) that the July job openings rate was unchanged from the prior month at 3.0%. Nevertheless, it still was the highest level since January. The job openings rate is the number of job openings on the last business day of the month as a percent of total employment plus job openings.
The actual number of job openings fell 1.3% m/m to 4.225 million (+8.6% y/y). Private sector openings fell 1.6% m/m (+10.1% y/y) as widespread declines were registered in the professional & business services (-1.6% m/m), retail trade (-1.2% m/m) and transportation & utilities (-2.4% m/m) industries. Notably (job openings in the construction industry rose 22.3% m/m.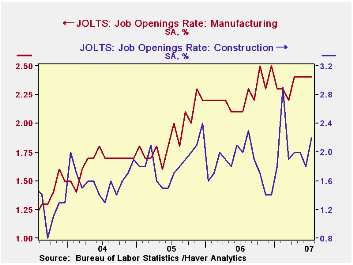
The hires rate improved slightly m/m to 3.5% and made up a bit of the prior month's decline. The recent peak for this series was one year earlier at 3.8%. The hires rate is the number of hires during the month divided by employment.
The actual number of hires rose 1.6% (-6.3% y/y) to 4.816 million. Retail sector jobs rose by 2.0% (-19.6% y/y) making only a small piece of June's 15.4% drop. Hires in the construction industry rose by 14.8% (9.0% y/y) and factory sector jobs were about unchanged m/m (-5.6% y/y).
The job separations rate in July fell slightly m/m to 3.2%. Separations include quits, layoffs, discharges, and other separations as well as retirements. The total separations, or turnover, rate is the total number of separations during the month divided by employment. The level of job separations fell a harder 1.4% (-3.5% y/y) from June.
The JOLTS survey dates only to December 2000 but has since followed the movement in nonfarm payrolls, though the actual correlation between the two series is low.
A description of the Jolts survey and the latest release from the U.S. Department of Labor is available here.
Yesterday's speech by Federal Reserve Board Chairman Ben S. Bernanke, Global Imbalances: Recent Developments and Prospects, can be found here.
| JOLTS (Job Openings & Labor Turnover Survey) | July | June | July '06 | 2006 | 2005 | 2004 |
|---|---|---|---|---|---|---|
| Job Openings Rate: Total | 3.0% | 3.0% | 2.8% | 3.1% | 2.8% | 2.5% |
| Hires Rate: Total | 3.5% | 3.4% | 3.8% | 43.6% | 43.1% | 41.7% |
by Carol Stone September 12, 2007
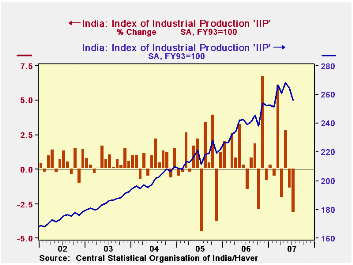
Industrial production in India has declined for two months now, with the July data out today showing a 3.2% drop from June in figures seasonally adjusted by Haver Analytics. This pulled July's year-on-year growth to 7.1% (not seasonally adjusted) from 10.4% in Q2 and 12.5% in Q1. The peak individual growth month was November 2006, which was a striking 15.8% above November 2005.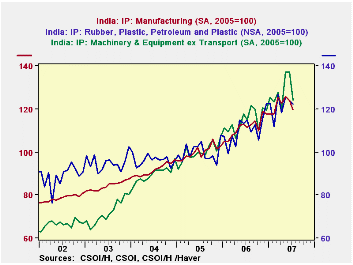
In the manufacturing sector, which makes up 79% of this index, a variety of industries have participated in this recent slowing. Wood products are perhaps most notable: including furniture and fixtures, this group lurched upward dramatically from December through March and moved irregularly after that, falling nearly 24% in July. The same pattern, though less extreme, is found in machinery production. It fell in the latest month by 9.5%, but, as seen in the second graph, it had expanded greatly in May, by 14.5% in fact, to an elevated level. We plot it here along with total manufacturing and another leading industry, rubber, plastics and petroleum. To see their movements in relation to each other, we can use Haver's DLXVG3 "scale option" to put all of these series on some convenient index base; here, if we use 2005, we see that overall, the broad manufacturing sector along with the machinery industry and the rubber & plastics products group have grown along very similar trends since 2005. The July decline in machinery only just brought it back in line with the others.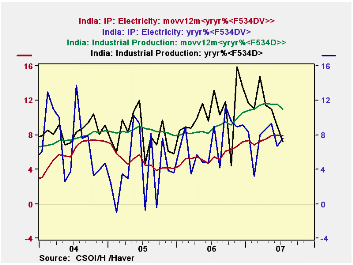
Not all industries show this exact behavior, up in the previous few months and then down in July. Others seem to be plateauing following an earlier run-up. Examples cut across industry types: basic metals, nonmetallic mineral products and chemicals. Only transportation equipment appears to be in an outright downtrend.
The one sector among Indian industries that is growing persistently is electric utilities. Electrical output was up 7.5% in July from a year ago. As the final graph shows, year-to-year growth rates are highly volatile. So, using DLXVG3's new nesting capability, we've averaged them over 12-month periods to find the trend. The July value of this measure is 7.9% and was 8.0% in June. These two months are the strongest since Q1 of 1996, more than 11 years ago. Overall industrial production grows faster, but notably in recent months, as the broader measure has gyrated, the electricity sector has moved more steadily higher. This means that non-industrial users are finding new ways to utilize electric power, taking up the slack when industry slows.
| INDIA, 1993/94 = 100* | July 2007 | June 2007 | May 2007 | 2006 | 2005 | 2004 |
|---|---|---|---|---|---|---|
| Index of Industrial Production | 256.2 | 264.6 | 268.4 | 239.6 | 216.7 | 200.8 |
| Mo/Mo % Change | -3.2 | -1.4 | 2.8 | -- | -- | -- |
| Yr/Yr % Change | 7.1 | 9.0 | 10.9 | 10.5 | 7.9 | 8.5 |
| Manufacturing Index | 273.6 | 283.8 | 287.7 | 255.0 | 228.7 | 209.8 |
| Yr/Yr % Change | 7.2 | 9.9 | 11.7 | 11.5 | 9.0 | 8.9 |
| Electricity Index | 220.1 | 215.3 | 217.5 | 201.5 | 188.0 | 180.7 |
| Yr/Yr % Change | 7.5 | 6.8 | 9.4 | 7.2 | 4.0 | 7.2 |
by By Robert Brusca September 12, 2007
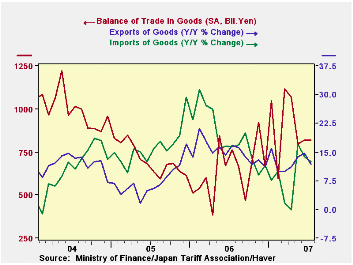
Japan's current account surplus shrinks in July.
The terms of trade have turned against Japan over the past year as export prices rose by just 10.2% and import prices rose by 26.3%. Exports and imports have been in a broader slowing but in the recent three months they accelerated from Q1 weakness. Japan’s exports and imports are showing signs of catching on and reaccelerating after this slowdown. Japan’s surplus is reviving, albeit erratically.
| Jul-07 | Jun-07 | May-07 | 3-Mo | 6-Mo | 12-Mo | 12 mo Prev | |
| Current Account in $, Mln | $ 14,446 | $ 16,682 | $ 18,435 | $ 16,521 | $ 16,879 | $ 15,948 | $ 13,919 |
| IN Yen, 100 Mln | |||||||
| Overall Balance | 17,539 | 20,467 | 22,264 | 20,090 | 20,269 | 18,982 | 16,052 |
| Balance on Goods | 8,434 | 8,923 | 9,634 | 8,997 | 9,485 | 9,266 | 7,556 |
| Export Goods % SAAR | 0.1% | 1.0% | 4.6% | 25.1% | 4.6% | 11.1% | 29.8% |
| Import Goods %, SAAR | 0.9% | 2.4% | 8.4% | 67.7% | 17.1% | 11.8% | 33.7% |
| Services Balance | (2,371) | (1,898) | (2,060) | (2,110) | (2,085) | (1,966) | (1,795) |
| Prices In %, SAAR | |||||||
| Export Prices | -1.3% | 0.6% | 3.1% | 15.8% | 1.7% | 5.2% | 10.2% |
| Import Prices | -1.0% | 1.3% | 4.6% | 34.1% | 5.1% | 8.9% | 26.3% |
| Memo: Yen/$ | 121.41 | 122.69 | 120.77 | 121.62 | 120.26 | 119.03 | 115.29 |
by By Robert Brusca Euro Area Output Rebounds in July September 12, 2007
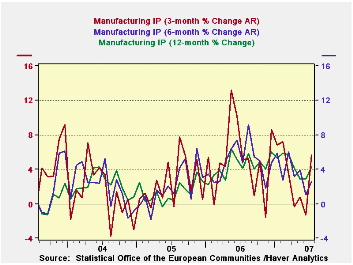
Trends in Euro area production seem solid; recent months seem less certain.
The chart shows that there were several months of output slowdown in early to mid summer period. July, however, brings a rebound to what had been flagging trends. The three-month trend is clearly revived; the others are not revived as clearly, but their decline is arrested. And with the financial turmoil in markets we will want to see August and September data for sure to draw meaningful conclusions about trend.
May was a strong month for output and by and large it has carried the quarter. Output for capital goods and for intermediate goods has expanded steadily in recent months, but intermediate goods is off to a weak start in Q3. For consumer goods, June and July are a weak pair of months for output and consumer goods output is off to a moderate start in Q3 as well.
Major Euro area countries that have reported have showed output strength in the recent three months. Germany alone has weak trends in June and July. The UK, an EU member, has had three weak months in a row and its output is lower in the new quarter compared to Q2.
| Saar except m/m | Mo/Mo | Jul-07 | Jul-07 | Jul-07 | |||
| Euro area Detail | Jul-07 | Jun-07 | May-07 | 3-Mo | 6-mo | 12-mo | Q-2-Date |
| MFG | 0.6% | -0.1% | 0.8% | 5.6% | 2.6% | 4.2% | 5.2% |
| Consumer Goods | 0.3% | -0.3% | 0.6% | 2.2% | 0.9% | 2.8% | 1.6% |
| Consumer Durable Goods | -0.1% | 0.0% | 1.8% | 6.9% | 1.2% | 2.0% | -- |
| Consumer Nondurable Goods | 0.3% | -0.4% | 0.5% | 2.0% | 1.0% | 3.0% | -- |
| Intermediate Goods | 0.5% | 0.2% | 0.9% | 6.1% | 2.3% | 3.7% | 0.0% |
| Capital Goods | 1.0% | 0.2% | 1.1% | 9.5% | 4.6% | 6.3% | 3.4% |
| Memo: MFG | 1-Mo% | 1-Mo% | 1-Mo% | 3-Mo | 6-mo | 12-mo | Q-2-Date |
| Germany | 0.2% | -0.3% | 1.9% | 7.0% | 3.1% | 5.7% | 3.4% |
| France: IP excl Construction | 1.3% | -0.6% | 0.8% | 5.9% | 3.9% | 2.6% | 6.9% |
| Spain | 1.9% | -3.9% | 6.8% | 19.3% | -8.6% | 4.2% | 8.3% |
| UK | -0.3% | 0.1% | 0.3% | 0.4% | 0.8% | 0.8% | -0.8% |

Tom Moeller
AuthorMore in Author Profile »Prior to joining Haver Analytics in 2000, Mr. Moeller worked as the Economist at Chancellor Capital Management from 1985 to 1999. There, he developed comprehensive economic forecasts and interpreted economic data for equity and fixed income portfolio managers. Also at Chancellor, Mr. Moeller worked as an equity analyst and was responsible for researching and rating companies in the economically sensitive automobile and housing industries for investment in Chancellor’s equity portfolio. Prior to joining Chancellor, Mr. Moeller was an Economist at Citibank from 1979 to 1984. He also analyzed pricing behavior in the metals industry for the Council on Wage and Price Stability in Washington, D.C. In 1999, Mr. Moeller received the award for most accurate forecast from the Forecasters' Club of New York. From 1990 to 1992 he was President of the New York Association for Business Economists. Mr. Moeller earned an M.B.A. in Finance from Fordham University, where he graduated in 1987. He holds a Bachelor of Arts in Economics from George Washington University.
More Economy in Brief


