 Global| Nov 06 2007
JOLTS: Job Openings Unchanged, Hires Rate Depressed
by:Tom Moeller
|in:Economy in Brief
Summary
The Bureau of Labor Statistics reported in the Job Openings & Labor Turnover Survey (JOLTS) that the September job openings rate was unchanged from the prior month at 2.9%. That level was, however, down from the highs of late last [...]
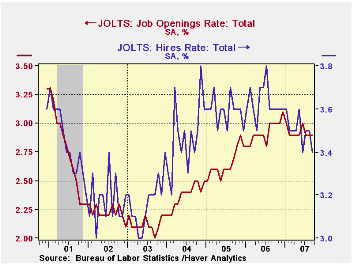
The Bureau of Labor Statistics reported in the Job Openings & Labor Turnover Survey (JOLTS) that the September job openings rate was unchanged from the prior month at 2.9%. That level was, however, down from the highs of late last year. The job openings rate is the number of job openings on the last business day of the month as a percent of total employment plus job openings.
The actual number of job openings was down 0.5% m/m to 4.115 million (-0.7% y/y). While the y/y comparison shows a moderate 0.7% decline in the number of job openings, they are down nearly 6% from year end 2006. Professional & business service sector openings fell 10.2%, retail trade fell 20.4% and while openings in the construction industry rose slightly it was after steep declines late last year.
The hires rate fell just slightly m/m to 3.4%. The
hires rate is the number of hires during the month divided by
employment.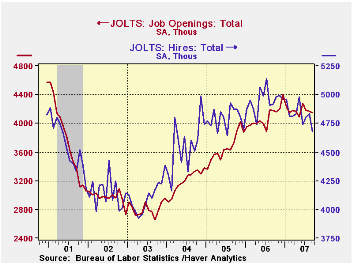
The actual number of hires fell 3.3% (-4.9% y/y) to 4.677 million and hires are down 5.5% since the end of last year. Hires in the construction industry remained down 1.2% since yearend and factory sector hires were 8.3% lower.
The job separations rate in September was steady at 3.2%, but down from 3.3% a year earlier. Separations include quits, layoffs, discharges, and other separations as well as retirements. The level of job separations fell 4.1% since yearend 2006.
The JOLTS survey dates only to December 2000 but has since followed the movement in nonfarm payrolls, though the actual correlation between the two series is low.
A description of the Jolts survey and the latest release from the U.S. Department of Labor is available here.
| JOLTS (Job Openings & Labor Turnover Survey) | September | August | Sept '06 | 2006 | 2005 | 2004 |
|---|---|---|---|---|---|---|
| Job Openings Rate: Total | 2.9% | 2.9% | 3.0% | 3.1% | 2.8% | 2.5% |
| Hires Rate: Total | 3.4% | 3.5% | 3.6% | 43.6% | 43.1% | 41.7% |
by Tom Moeller November 6, 2007
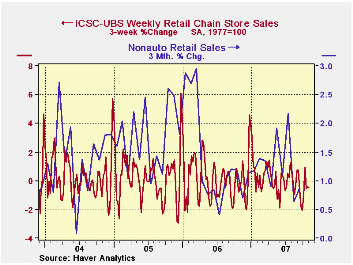
Chain store sales during the opening week of November jumped 1.0% from the week prior according to the International Council of Shopping Centers (ICSC)-UBS. The gain followed a 0.1% up tick during the prior week.
As a result of rise, early November sales began the month 0.5% ahead of the October average which fell 0.8% from September.
During the last ten years there has been a 45% correlation between the y/y change in chain store sales and the change in nonauto retail sales less gasoline.
The ICSC-UBS retail chain-store sales index is constructed using the same-store sales (stores open for one year) reported by 78 stores of seven retailers: Dayton Hudson, Federated, Kmart, May, J.C. Penney, Sears and Wal-Mart
The leading indicator of chain store sales from ICSC-UBS rose 0.8% (0.5% y/y) after declines during the two prior weeks.
The October 2007 Senior Loan Officer Opinion Survey on Bank Lending Practices from the Federal Reserve Board is available here.
| ICSC-UBS (SA, 1977=100) | 11/03/07 | 10/27/07 | Y/Y | 2006 | 2005 | 2004 |
|---|---|---|---|---|---|---|
| Total Weekly Chain Store Sales | 477.8 | 473.3 | 2.4% | 3.3% | 3.6% | 4.7% |
by Tom Moeller November 6, 2007
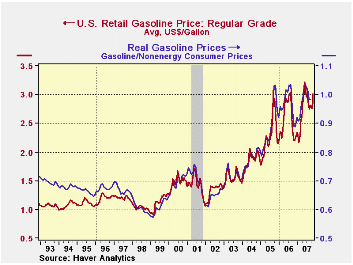
On average, retail gasoline prices topped $3.00 per gallon
last week, according to the US Department of Energy survey. The level
was not a record as it was still below the highs reached in early June.
It did, however, represent a 7.5% increase from the average level in
October and a roughly one third increase from prices a year earlier. 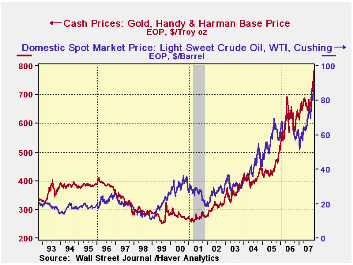
Divided by consumer prices other than energy, these gasoline prices are just 6% below the high reached in 1981.
Higher crude oil prices have driven the price increase. On Friday, spot WTI crude stood at $90.39 per barrel, up by half the price during late 2006.
In another inflation signal, gold prices rose to near $800 per ounce, the level surpassed the previous record price reached in early 1980.
Energy Prices and the Economy, a 2004 article from the Federal Reserve Bank of Dallas is available here.
| Weekly Prices | 11/05/07 | 10/31/07 | Y/Y | 2006 | 2005 | 2004 |
|---|---|---|---|---|---|---|
| Retail Gasoline ($ per Gallon) | 3.01 | 2.87 | 37.0% | 2.57 | 2.27 | 1.85 |
| Light Sweet Crude Oil, WTI ($ per bbl.) | 90.39 | 86.48 | 53.9% | 61.11 | 58.16 | 41.78 |
| Gold: Handy & Harmon ($ per Troy Oz.) | $783.25 | $758.25 | 29.7% | 628.70 | $507.40 | $443.40 |
by Robert Brusca November 6, 2007
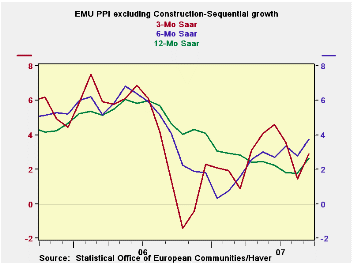
The ex-energy PPI is not showing the same acceleration as the headline and is in fact decelerating across the main countries except for the UK, an EU country. If we look at the sequential growth rates by product in the table we find that most categories are showing price deceleration as well. Capital goods are a minor exception. Consumer goods show a more pronounced acceleration in inflation. Overall EMU inflation is decelerating excluding energy to 2.7% over three months from 3.1% over six months and 3% year-over-year. At a 2.7% pace it still is well over the 2% inflation ceiling for the HICP that has been set by the ECB. Among main PPI components only intermediate goods inflation is below 2% over three months. Germany posts 3-month PPI inflation that is below 2% for both overall and ex-energy measures in September.
| Euro area and UK PPI Trends | ||||||
|---|---|---|---|---|---|---|
| M/M | Saar | |||||
| Euro area 13 | Sep-07 | Aug-07 | 3-Mo | 6-MO | Yr/Yr | Y/Y Yr Ago |
| Total ex Construction | 0.4% | 0.1% | 2.9% | 3.3% | 2.7% | 4.6% |
| Excl Energy | 0.2% | 0.3% | 2.7% | 3.1% | 3.0% | 3.6% |
| Capital Goods | 0.1% | 0.0% | 1.0% | 0.9% | 1.6% | 1.7% |
| Consumer Goods | 0.5% | 0.5% | 5.8% | 4.2% | 2.9% | 1.7% |
| Intermediate & Capital Goods | 0.1% | 0.1% | 1.3% | 2.6% | 3.1% | 4.6% |
| Energy | 1.0% | -0.5% | 3.5% | 4.2% | 1.6% | 7.8% |
| MFG | 0.4% | 0.1% | 3.3% | 4.6% | 3.4% | 2.8% |
| Germany | 0.2% | 0.1% | 0.7% | 1.5% | 1.5% | 5.1% |
| Ex Energy | 0.0% | 0.3% | 1.5% | 2.4% | 2.5% | 2.8% |
| Itlay | 0.5% | 0.2% | 4.4% | 4.2% | 3.5% | 5.5% |
| Ex Energy | 0.1% | 0.3% | 2.1% | 2.8% | 3.1% | 4.1% |
| UK | 0.5% | 0.0% | 4.5% | -0.6% | 2.6% | 6.2% |
| Ex Energy | 0.2% | 0.2% | 2.9% | 2.1% | 2.9% | 3.1% |
| Euro area 13 Harmonized PPI excluding Construction | ||||||
| The EA 13 countries are Austria, Belgium, Finland, France, Germany, Greece, Ireland, Italy, Luxembourg, the Netherlands, Portugal, Slovenia and Spain. | ||||||
by Robert Brusca November 6, 2007
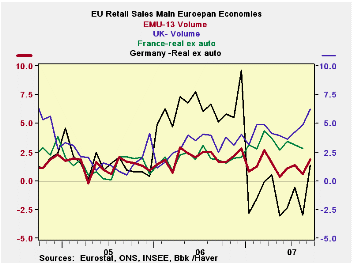
EMU-13 retail sales are up by a smaller than expected 0.3% in September. The previous month was revised higher by 0.7% but we still find EMU retail sales on a weak trend, with a hint of pick-up. French sales have been weakening while in Germany sales have jumped into positive territory after contracting in the earlier months. The UK, an EU nation, shows the strongest sales and there sales are still accelerating. We do not yet have detail for the current month but trend calculations by item are in the shaded portion of the table using data that lag by one month. They show some degree of pick up through August.
| Euro area 13 Retail Sales Volume | ||||||
|---|---|---|---|---|---|---|
| Sep-07 | Aug-07 | Jul-07 | 3-Mo | 6-MO | 12-Mo | |
| EA-13 Total | 0.3% | 0.0% | 0.4% | 3.0% | 1.2% | 1.9% |
| Food | #N/A | 0.2% | 0.2% | #N/A | #N/A | #N/A |
| Nonfood | #N/A | -0.1% | 0.5% | #N/A | #N/A | #N/A |
| Textiles | #N/A | -0.4% | 0.9% | 14.2% | 2.6% | 0.5% |
| HH Goods | #N/A | 0.5% | 0.5% | 10.1% | 4.2% | 1.7% |
| Books news, etc | #N/A | -0.2% | 0.5% | 8.1% | 3.4% | 2.1% |
| Pharmaceutical | #N/A | 0.1% | 0.3% | 2.4% | 3.1% | 2.6% |
| Other Nonspecified | #N/A | -0.6% | -0.1% | 2.5% | -0.5% | -1.1% |
| Mail Order | #N/A | 0.2% | -0.6% | 0.8% | 0.4% | -2.5% |
| Nonfood Country Detail: Volume | ||||||
| Germany | 1.3% | 0.4% | -0.3% | 5.8% | 5.0% | 2.5% |
| France | 0.6% | -0.4% | 0.5% | 5.7% | 5.0% | 4.2% |
| Italy (Total; Value) | #N/A | -0.1% | -0.1% | -1.0% | -1.8% | -1.8% |
| UK (EU) | 0.6% | 0.7% | 0.8% | 8.4% | 6.8% | 8.8% |
| Shaded areas calculated on a one-month lag due to lagging data | ||||||
| The EA 13 countries are Austria, Belgium, Finland, France, Germany, Greece, Ireland, Italy, Luxembourg, the Netherlands, Portugal, Slovenia and Spain. | ||||||
by Louise Curley November 6, 2007
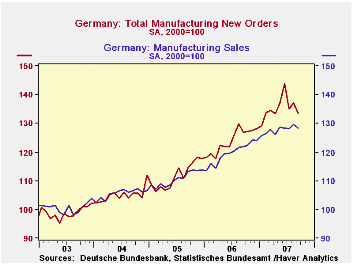
The index of German new orders for manufacturing goods fell 2.6% in September to 133.6 (2000=100) from August, but was still more than 5% above September, 2006. The index of manufacturing sales fell 1.1% in September from August but was 4.2% above September 2006. The first chart shows the indexes for manufacturing new orders and sales.
Domestic orders declined 3.2% and foreign orders 2.2%. The greater decline in domestic orders is somewhat misleading. Included in the foreign orders are orders from the Euro Area countries which are not affected by currency changes. In September orders from these countries increased 0.7% while foreign orders from non Euro area countries declined by 4.6%. It is these non Euro Area countries that have been affected by the rise in the euro. The significant decline in their new orders attests to the impact of the higher euro. The second chart shows the indexes of domestic new orders and the Euro Area and non Euro Area new orders.
All three areas--domestic, Euro Area and non Euro Area--have also been affected by the uncertainties caused by after effects of the turmoil in the US sub prime mortgage market. These effects are seen in the decline in sales to these areas. Manufacturing sales to the domestic market declined 1.1% in September and 1.2% in the foreign market. The decline in sales to the Euro Area countries (1.2%), was greater than that to the non Euro Area countries (1.0%).The decline in new orders suggests that further declines in sales are in the pipelines. The third chart shows the indexes of domestic sales and the Euro Area and non Euro Area sales.
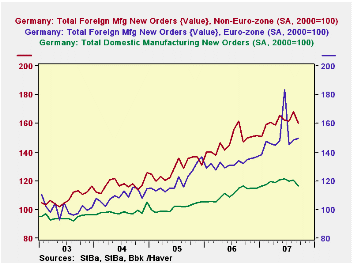
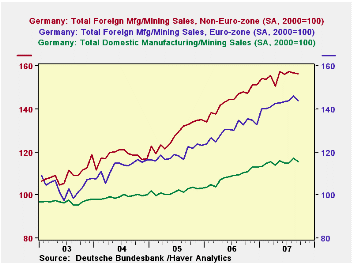
| GERMAN MANUFACTURING NEW ORDERS AND SALES (2000=100) | Sep 07 | Aug 07 | Sep 06 | M/M %Chg | Y/Y %Chg | 2006 | 2005 | 2004 |
|---|---|---|---|---|---|---|---|---|
| New Orders Total | 133.6 | 137.2 | 126.9 | -2.62 | 5.28 | 123.9111. | 105.1 | |
| Domestic | 116.4 | 120.2 | 116.5 | -3.16 | -1.09 | 110.9 | 101.4 | 99.3 |
| Foreign | 155.0 | 158.5 | 139.8 | -2.21 | 10.87 | 140.1 | 124.7 | 113.6 |
| Euro Area | 149.4 | 148.3 | 131.8 | 0.74 | 13.35 | 132.1 | 120.4 | 109.6 |
| Non Euro Area | 160.1 | 167.8 | 147.1 | -4.59 | 8.84 | 147.4 | 128.6 | 117.1 |
| Sales Total | 128.3 | 129.7 | 121.8 | -1.08 | 5.34 | 119.6 | 110.6 | 105.5 |
| Domestic | 115.1 | 116.5 | 110.5 | -1.20 | 4.16 | 108.8 | 102.7 | 99.4 |
| Foreign | 150.6 | 152.1 | 140.9 | -0.99 | 6.88 | 137.8 | 123.9 | 115.9 |
| Euro Area | 143.8 | 146.1 | 132.5 | -1.57 | 8.53 | 130.3 | 119.1 | 112.9 |
| Non Euro Area | 156.3 | 156.9 | 148.0 | -0.38 | 5.61 | 144.1 | 128.0 | 118.1 |
Tom Moeller
AuthorMore in Author Profile »Prior to joining Haver Analytics in 2000, Mr. Moeller worked as the Economist at Chancellor Capital Management from 1985 to 1999. There, he developed comprehensive economic forecasts and interpreted economic data for equity and fixed income portfolio managers. Also at Chancellor, Mr. Moeller worked as an equity analyst and was responsible for researching and rating companies in the economically sensitive automobile and housing industries for investment in Chancellor’s equity portfolio. Prior to joining Chancellor, Mr. Moeller was an Economist at Citibank from 1979 to 1984. He also analyzed pricing behavior in the metals industry for the Council on Wage and Price Stability in Washington, D.C. In 1999, Mr. Moeller received the award for most accurate forecast from the Forecasters' Club of New York. From 1990 to 1992 he was President of the New York Association for Business Economists. Mr. Moeller earned an M.B.A. in Finance from Fordham University, where he graduated in 1987. He holds a Bachelor of Arts in Economics from George Washington University.
More Economy in Brief
 Global| Feb 05 2026
Charts of the Week: Balanced Policy, Resilient Data and AI Narratives
by:Andrew Cates


