 Global| Apr 28 2006
Jobs in Canada Show Pick-Up, Even in Manufacturing
Summary
Besides its monthly labor force survey to measure the number of people employed, Statistics Canada also conducts a survey of establishments, similar to that in the United States. These industry establishment data are part of the [...]
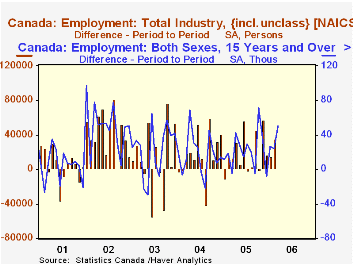
Besides its monthly labor force survey to measure the number of people employed, Statistics Canada also conducts a survey of establishments, similar to that in the United States. These industry establishment data are part of the compilation of Canada's monthly GDP series. As with the labor force series, the industry data show good jobs growth in the first two months of 2006, including gains of 15,087 and 34,641 in January and February, respectively.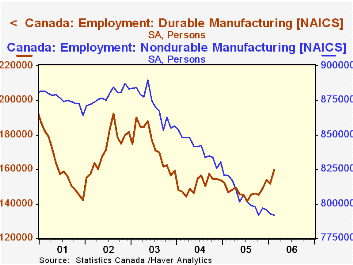
At the same time, the establishment data indicate some firming in the manufacturing sector that is not evident in the labor force series. After a long decline, the former began to turn upward in November; the cumulative increase over the four months is only 12,600, but it includes a more marked upturn in the durable goods sector totaling 18,300 since last July. Employment at nondurable goods manufacturers continues in a downward drift. By contrast, the labor force measure shows that the number of people working in manufacturing is still falling, a decrease of 1.2% since October, compared to the 0.7% increase in manufacturing company jobs. These series are not well correlated month-to-month, and can be erratic, so these comparisons could easily be erased by one or two months of reversals in either dataset. Even so, the gain in manufacturing establishment jobs is intriguing, and the labor force series bears monitoring for a sign of new growth there.
Service sector jobs are picking up steam in the establishment data. These had slowed to just a 1.4% increase in 2004, but grew 1.9% last year and through February were already 2.4% ahead of a year ago. The gain in the service industries and the better performance of manufacturing are contributing to growth in Canada's monthly GDP of 3.3% year-on-year in February, somewhat firmer than last year's overall increase of 3.0%.
| SA, Thousands | Feb 2006 | Jan 2006 | Year Ago | 2005 | 2004 | 2003 |
|---|---|---|---|---|---|---|
| Total NAICS Industries | 13,922 | 13,887 | 13,647 | 13,743 | 13,515 | 13,337 |
| Mo/Mo (000) & Yr/Yr % Changes | 34.6 | 15.1 | 2.0% | 1.7% | 1.3% | 2.1% |
| Manufacturing | 1,950 | 1,944 | 1,967 | 1,952 | 1,991 | 2,045 |
| Mo/Mo (000) & Yr/Yr % Changes | 6.1 | -4.9 | -0.8% | -2.0% | -2.6% | -0.3% |
| Service Producing | 10,709 | 10,682 | 10,463 | 10,550 | 10,351 | 10,213 |
| Mo/Mo (000) & Yr/Yr % Changes | 26.9 | 18.9 | 2.4% | 1.9% | 1.4% | 2.1% |
| GDP: Mo/Mo & Yr/Yr % Changes | 0.2% | 0.2% | 3.3% | 3.0% | 3.2% | 2.3% |
Carol Stone, CBE
AuthorMore in Author Profile »Carol Stone, CBE came to Haver Analytics in 2003 following more than 35 years as a financial market economist at major Wall Street financial institutions, most especially Merrill Lynch and Nomura Securities. She had broad experience in analysis and forecasting of flow-of-funds accounts, the federal budget and Federal Reserve operations. At Nomura Securities, among other duties, she developed various indicator forecasting tools and edited a daily global publication produced in London and New York for readers in Tokyo. At Haver Analytics, Carol was a member of the Research Department, aiding database managers with research and documentation efforts, as well as posting commentary on select economic reports. In addition, she conducted Ways-of-the-World, a blog on economic issues for an Episcopal-Church-affiliated website, The Geranium Farm. During her career, Carol served as an officer of the Money Marketeers and the Downtown Economists Club. She had a PhD from NYU's Stern School of Business. She lived in Brooklyn, New York, and had a weekend home on Long Island.
More Economy in Brief


