Global| Jan 04 2002
Job Losses Moderate
by:Tom Moeller
|in:Economy in Brief
Summary
Nonfarm payrolls fell last month by the least amount in four months and by slightly less than consensus estimates for a 170,000 worker decline. Prior months' figures were little revised. From the household survey, the unemployment [...]
Nonfarm payrolls fell last month by the least amount in four months and by slightly less than consensus estimates for a 170,000 worker decline. Prior months' figures were little revised. From the household survey, the unemployment rate rose to an expected 5.8% as employment declined 198,000 following a revised 362,000 November decline. Diffusion indexes of payroll employment improved on a one-month basis but fell over longer time periods. Manufacturing payrolls again fell 0.8% following a downwardly revised 1.0% November drop. Employment in the service sector was unchanged as strength in government hiring offset a decline in business services and general merchandise stores. The index of aggregate hours worked (employment times hours worked) was unchanged but the 4Q average was 3.9% (AR) below 3Q. Average hourly earnings rose more than expected and the prior months' figure was revised up. These figures reflect mix shifts.
The establishment survey figures for nonfarm payrolls are based on reports provided to the US Labor Dept. by businesses. The household survey figures (incl. the unemployment rate) are based on a mail survey of US households.
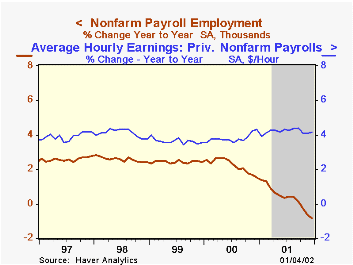 |
| · Nonfarm payrolls fell last month by the least amount in four months and by slightly less than consensus estimates for a 170,000 worker decline. Prior months' figures were little revised. |
|---|
| · From the household survey, the unemployment rate rose to an expected 5.8% as employment declined 198,000 following a revised 362,000 November decline. |
|---|
| · Diffusion indexes of payroll employment improved on a one-month basis but fell over longer time periods. |
|---|
| · Manufacturing payrolls again fell 0.8% following a downwardly revised 1.0% November drop. |
|---|
| · Employment in the service sector was unchanged as strength in government hiring offset a decline in business services and general merchandise stores. |
|---|
| · The index of aggregate hours worked (employment times hours worked) was unchanged but the 4Q average was 3.9% (AR) below 3Q. |
|---|
| · Average hourly earnings rose more than expected and the prior months' figure was revised up. These figures reflect mix shifts. |
|---|
| · The establishment survey figures for nonfarm payrolls are based on reports provided to the US Labor Dept. by businesses. The household survey figures (incl. the unemployment rate) are based on a mail survey of US households. |
|---|
| Employment | Dec '01 | Nov '01 | Y/Y | 2001 | 2000 | 1999 |
|---|---|---|---|---|---|---|
| Payroll Employment | -124,000 | -371,000 | -0.8% | 0.4% | 2.2% | 2.4% |
| Manufacturing | -133,000 | -165,000 | -7.2% | -4.2% | -0.5% | -1.3% |
| Average Weekly Hours | 34.2 | 34.1 | 34.2 | 34.2 | 34.4 | 34.5 |
| Average Hourly Earnings | 0.5% | 0.5% | 4.1% | 4.2% | 3.8% | 3.6% |
| Unemployment Rate | 5.8% | 5.6% | 4.0% | 4.8% | 4.0% | 4.2% |
by Tom Moeller January 4, 2002
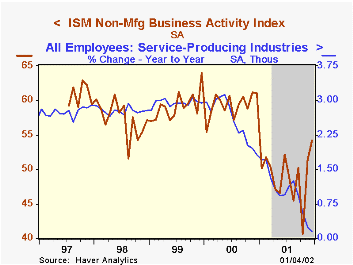
The Institute for Supply Management (formerly the NAPM) business activity index of the nonmanufacturing sector was stronger than expected last month. A slight decline had been expected.
New orders rose slightly following a November surge. Employment and imports rose.
Business activity for the nonmanufacturing sector is a question separate from the components mentioned above. This is in contrast to the NAPM manufacturing sector composite index that reflects component activity.
During the last four years, there has been a 38% correlation between the level of the NAPM nonmanufacturing index and quarterly growth in real GDP in the service sector.
The survey of nonmanufacturing activity dates only to July 1997. Therefore its seasonal adjustment should be viewed tentatively.
| ISM Nonmanufacturing Survey | Dec '01 | Nov '01 | Y/Y | 2001 | 2000 | 1999 |
|---|---|---|---|---|---|---|
| Business Activity Index | 54.2 | 51.3 | 61.1 | 49.1 | 59.3 | 59.2 |
by Tom Moeller January 4, 2002
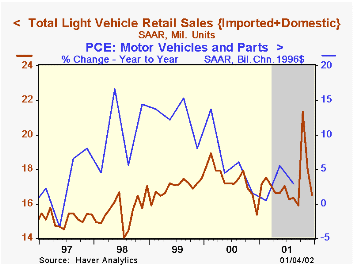
Light vehicle sales fell sharply last month; payback after strength in October and November fueled by 0% financing plans. Sales were slightly better than expected.
Despite the decline, December sales were above the rates logged during the weak summer quarter.
Sales of both domestic and imported vehicles fell month-to-month, although domestics (-9.6%) fell morethan imports (-2.5%).
Sales of both cars and trucks fell, although cars by more.
| Light Vehicle Sales (SAAR, Mil.Units) | Dec '01 | Nov '01 | Y/Y | 2001 | 2000 | 1999 |
|---|---|---|---|---|---|---|
| Total | 16.51 | 18.01 | 7.5% | 17.21 | 17.40 | 16.95 |
| Domestic | 13.27 | 14.68 | 5.8% | 14.15 | 14.58 | 14.47 |
| Imported | 3.25 | 3.33 | 15.0% | 3.06 | 2.82 | 2.48 |

Tom Moeller
AuthorMore in Author Profile »Prior to joining Haver Analytics in 2000, Mr. Moeller worked as the Economist at Chancellor Capital Management from 1985 to 1999. There, he developed comprehensive economic forecasts and interpreted economic data for equity and fixed income portfolio managers. Also at Chancellor, Mr. Moeller worked as an equity analyst and was responsible for researching and rating companies in the economically sensitive automobile and housing industries for investment in Chancellor’s equity portfolio. Prior to joining Chancellor, Mr. Moeller was an Economist at Citibank from 1979 to 1984. He also analyzed pricing behavior in the metals industry for the Council on Wage and Price Stability in Washington, D.C. In 1999, Mr. Moeller received the award for most accurate forecast from the Forecasters' Club of New York. From 1990 to 1992 he was President of the New York Association for Business Economists. Mr. Moeller earned an M.B.A. in Finance from Fordham University, where he graduated in 1987. He holds a Bachelor of Arts in Economics from George Washington University.
More Economy in Brief