 Global| Oct 15 2008
Japanese IP Dives – Back on Trend to Lower Results
Summary
What a shock to those that thought that decoupling was a reality. The US slowdown clearly has spread to Japan and to Europe. The August drop in output is just one of the visible signs. July’s 1.3% rise in IP is sandwiched between [...]
What a shock to those that thought that decoupling was a
reality. The US slowdown clearly has spread to Japan and to Europe. The
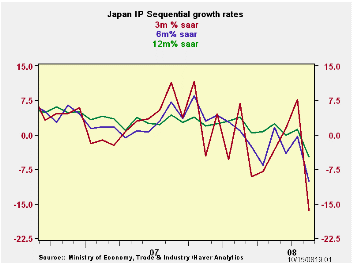
August drop in output is just one of the visible signs. July’s 1.3%
rise in IP is sandwiched between drops of 3.5% in August and 2.2% in
June. The global slowdown is everywhere. The financial crisis, of
course, is going to deepen it. The developing world ‘demand
juggernauts’ India and China will not escape the slowing either.
The decline is hitting Japan especially hard in transportation
as high gas prices have adversely impacted consumer budgets in the US.
A key issue for Japan is that car sales have plummeted. Even makers of
fuel efficient cars have seen demand fall off. The most highly sought
after models have been in short supply. Thus, even fuel efficient auto
makers are having trouble – no one escapes the downturn.
The outlook is for weakness to continue and probably to
deepen. The hit to industrial output in Japan, while relatively severe,
is not over.
| Japan Industrial Production Trends | ||||||||
|---|---|---|---|---|---|---|---|---|
| m/m % | Saar % | Yr/Yr | Qtr-2-Date | |||||
| seas adjusted | Aug-08 | Jul-08 | Jun-08 | 3-mo | 6-mo | 12-mo | Yr-Ago | % AR |
| Mining & mfg | -3.5% | 1.3% | -2.2% | -16.4% | -10.1% | -4.7% | 4.4% | -6.0% |
| Total Industry | -3.6% | 1.5% | -2.2% | -16.1% | -10.2% | -4.7% | 4.4% | -5.4% |
| MFG | -3.5% | 1.2% | -2.1% | -16.4% | -10.1% | -4.7% | 4.4% | -6.2% |
| Textiles | -0.2% | -2.9% | -1.6% | -17.5% | -13.5% | -10.0% | -6.2% | -20.9% |
| T-port | -9.8% | 4.0% | -5.0% | -36.9% | -19.3% | -7.8% | 9.7% | -9.3% |
| Product Group | ||||||||
| Consumer Goods | -3.3% | 3.6% | -3.1% | -11.3% | -8.0% | -3.2% | 6.3% | 7.9% |
| Intermediate Goods | -2.3% | -0.2% | -0.6% | -11.7% | -7.1% | -2.6% | 4.0% | -7.0% |
| Investment Goods | -5.2% | -0.5% | -2.9% | -29.8% | -18.5% | -10.9% | 2.8% | -22.1% |
| Mining | 1.6% | 4.2% | 1.9% | 35.1% | 15.3% | 4.3% | -1.1% | 28.2% |
| Electricity & Gas | -7.6% | 6.3% | -3.4% | -19.2% | -21.9% | -5.1% | 2.9% | 1.4% |

Robert Brusca
AuthorMore in Author Profile »Robert A. Brusca is Chief Economist of Fact and Opinion Economics, a consulting firm he founded in Manhattan. He has been an economist on Wall Street for over 25 years. He has visited central banking and large institutional clients in over 30 countries in his career as an economist. Mr. Brusca was a Divisional Research Chief at the Federal Reserve Bank of NY (Chief of the International Financial markets Division), a Fed Watcher at Irving Trust and Chief Economist at Nikko Securities International. He is widely quoted and appears in various media. Mr. Brusca holds an MA and Ph.D. in economics from Michigan State University and a BA in Economics from the University of Michigan. His research pursues his strong interests in non aligned policy economics as well as international economics. FAO Economics’ research targets investors to assist them in making better investment decisions in stocks, bonds and in a variety of international assets. The company does not manage money and has no conflicts in giving economic advice.
More Economy in Brief


