 Global| Dec 11 2019
Japan's PPI Ticks Higher in November Amid Curious Global Circumstances
Summary
Japan's PPI (domestic corporate goods price index) is up by 0.1% in November after an out-sized jump of 1.2% in October. Japan, despite the three-month PPI pace of a 4.8% annualized gain, does not show the trappings of momentum to [...]
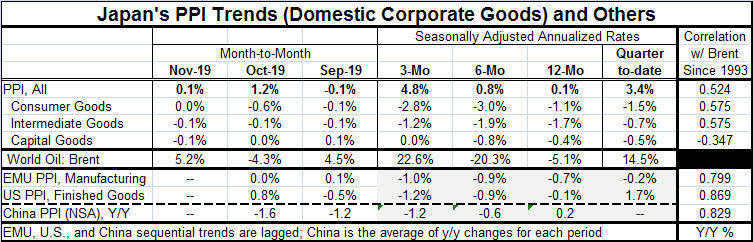
 Japan's PPI (domestic corporate goods price index) is up by 0.1% in November after an out-sized jump of 1.2% in October. Japan, despite the three-month PPI pace of a 4.8% annualized gain, does not show the trappings of momentum to justify a belief in inflation picking up. And quite separately, there is the matter of Japan's pancake-like CPI that over three-months, six-months and 12-months has no annualized growth rate in excess of 0.2%
The chart is a reminder that the PPI does tend to follow the pied-piper of oil prices. You can eyeball the topography of the two series on the right-scale-left-scale chart. In the table to the far right, a column memorializes the correlation of various PPI gauges with the Brent crude price index. This exercise is performed over year-on-year percentage price changes since 1993. And while Japan's PPI shows a clear association with Brent's movements, the correlations are much stronger for the United States, the EMU and China. In China, the PPI is falling and has been falling. China is separating itself from an oil impact.
China, of course, is being whacked by the U.S. trade situation and by tariffs imposed on its products and by the threat of more to come unless a deal is struck soon…very soon, like as soon as December 15. It may be that the U.S.-China negotiations are going well enough that the deadline could be pushed back or the imposition of tariffs suspended and there are hints of that from the Administration. But with President Trump, there is just no knowing until the doing.
Japan is caught in this cross fire as its largest trading partner is China and its second largest partner is the U.S. Having the U.S. and China at war and having both of those economies slowing puts stress on Japan's economy as well. In addition to any impact from global oil prices, China and the U.S. are seeing downward pressures on prices from slowing growth. Recent data from China seems to show that China has been leaning more than had been expected on credit extension to keep growth on track.
And a trade deal, if one is made, is not the end of the stress. In addition to trade talks and the ongoing slowdown, there will be continuing U.S.-China trade talks and there is the ongoing issue in Hong Kong as well. China's attention is stretched in several different directions creating more stress.
As for the impact of oil prices, the three-month and six-month percentage changes (annualized) are large but offsetting while the year-on-year change is a drop of -5%, a relatively small impact from oil prices. The small one year drop in oil prices should exert some small negative pull on the PPIs, but that should not dominate PPI price trends. At this point, PPI weakness should be more a matter of cyclical conditions and perhaps an outgrowth of weakness caused by the trade war.
Right now no country is showing upward pressure on its PPI. All PPIs are lower over 12 months except Japan's where the PPI is up by a skinny 0.1%. China's PPI is down by 1.6% year-over -year and its one-year average of its year-on-year change is +0.2% even though China's PPI is down year-over-year in each of the last four months.
To the extent that we can really drive a wedge between the CPI representing consumer prices and the PPI representing output prices, China is showing a split there with more weakness in output prices and rising consumer prices. Japan is showing more or less balanced sector price weakness. In the U.S., services prices boost the CPI above a goods only view of PPI prices. For the U.S. PPI and CPI prices off goods move more or less the same subject to index idiosyncrasies because product markets are so tight and markups thin and controlled. PPI prices as always are more volatile than CPI prices. However, even the tariffs on Chinese goods have had little impact on U.S. prices except for some special tariff effects on steel and aluminum. China depreciated its currency to swallow the U.S. tariff impact on Chinese exports (U.S. imports) so the impact on U.S. prices has been blunted.
Past trends show oil prices fluctuations between $133/barrel and $32/barrel since May 2008. But oil has been in a range of $80.50/barrel to $62.75/barrel since November 2017. While that still leaves some large short-run percentage changes in play, it is a much smaller range. And since prices have not dwelt at the extremes for this narrower range, the impact on other prices has been muted.
Growth has slowed and inflation expectations have been reined in. And as the dust settles, inflation everywhere remains below target, in some places by more (like Japan and Europe) and in other places by less (like in the U.S.). Policymakers are still trying to sort out how to make policy in this environment. The ECB is almost completely as sea as it has only a price objective and it has been far below it for a long time and yet conservative European policymakers are more nervous about having kept rates so low for so long and are indifferent to the inflation undershoot even though inflation is supposed to be all that matters to the ECB. Japan also continues its run with a chronic inflation undershoot as its central bank ponders the impact of this ongoing miss on its policy credibility. This past year Japan even addressed its huge debt-to-GDP ratio with a consumption tax hike despite inflation's ongoing undershooting. Japan's high debt constrains the use of social policy. Europe's Maastricht rules constrain the countries that might run deficits while the one that could under the rules run a deficit is instead running a surplus (Germany).
The U.S. continues to break all the rules with large ongoing and growing debt, a still firm currency and below-target inflation with tepid growth that is still better than in Europe and Japan as productivity continues to disappoint. There are too many inconsistencies in all this for these conditions to endure. But there is no agreement on what the breakout will be or what will cause it. There has been surprising little fallout from the U.S.-China trade war and despite that there are huge hopes that its end will provide stimulus for all. Is that possible? Can the upside be so promising when the downside was no muted?

Robert Brusca
AuthorMore in Author Profile »Robert A. Brusca is Chief Economist of Fact and Opinion Economics, a consulting firm he founded in Manhattan. He has been an economist on Wall Street for over 25 years. He has visited central banking and large institutional clients in over 30 countries in his career as an economist. Mr. Brusca was a Divisional Research Chief at the Federal Reserve Bank of NY (Chief of the International Financial markets Division), a Fed Watcher at Irving Trust and Chief Economist at Nikko Securities International. He is widely quoted and appears in various media. Mr. Brusca holds an MA and Ph.D. in economics from Michigan State University and a BA in Economics from the University of Michigan. His research pursues his strong interests in non aligned policy economics as well as international economics. FAO Economics’ research targets investors to assist them in making better investment decisions in stocks, bonds and in a variety of international assets. The company does not manage money and has no conflicts in giving economic advice.
More Economy in Brief


