 Global| Mar 13 2008
Japan's Industrial Sector Slows Down, Does the Economy?
Summary
Japan’s index of industrial output was revised lower. But the general growth trend remains in force. Year/year output trends are fairly stable at a moderate 2% or so rate of growth. Over six months, trends point lower; over 3 months [...]
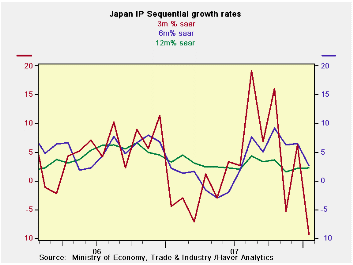 Japan’s index of industrial
output was revised lower. But the
general growth trend remains in force. Year/year output trends are
fairly stable at a moderate 2% or so rate of growth. Over six months,
trends point lower; over 3 months trends point sharply lower.
Japan’s index of industrial
output was revised lower. But the
general growth trend remains in force. Year/year output trends are
fairly stable at a moderate 2% or so rate of growth. Over six months,
trends point lower; over 3 months trends point sharply lower.
All major industrial and product growth sectors show weakness in the recent one-month and three-month periods. Textiles, investment goods and mining show the more persisting decelerating trends.
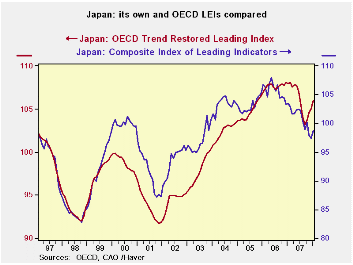
However, different leading indicators tell different stories
about Japan’s economy and where it is going. The OECD sees an upturn in
progress in six months, as its CLI has turned higher. Japan’s own
leading index is still locked in a downtrend going back to 2006.
The recent surge in the yen comes against this mixed background. In the past the yen has not been able to rise strongly unless the domestic economy was doing well. But in this case the yen’s rise is the counter part of the dollar’s ubiquitous fall. The yen may be driven more by the US and by yen funding unwinds than by Japan’s own fundamentals. The BOJ is not talking of intervention, indeed, the Keidanren, the influential Japan employers union, said it would not ask for intervention unless the dollar got much stronger.
Japan’s exports have been holding up and there is some talk of
improved productivity in Japanese companies. But the dollar’s move up
could put all of this in jeopardy. Year-over-year output trends remain
steady but over shorter horizons we do have something to think about.
| Japan Industrial Production Trends | |||||||
|---|---|---|---|---|---|---|---|
| m/m % | Saar % | Yr/Yr | |||||
| seas adjusted | Jan-08 | Dec-07 | Nov-07 | 3-mo | 6-mo | 12-mo | Yr-Ago |
| Mining & MFG | -2.2% | 1.4% | -1.6% | -9.3% | 2.6% | 2.2% | 3.2% |
| Total Industry | -2.6% | 1.7% | -1.3% | -8.6% | 3.4% | 2.3% | 2.6% |
| MFG | -2.2% | 1.4% | -1.6% | -9.6% | 2.6% | 2.1% | 3.2% |
| Textiles | -3.0% | 2.5% | -2.2% | -10.2% | -8.6% | -5.6% | -4.2% |
| Transport | -3.2% | 2.4% | -2.9% | -14.2% | 31.5% | 11.6% | 4.6% |
| Product Group | |||||||
| Consumer Goods | -1.7% | 2.1% | -2.1% | -6.8% | 12.8% | 4.0% | -0.8% |
| Intermediate Goods | -2.8% | 1.3% | -1.1% | -10.3% | 3.1% | 4.0% | 3.8% |
| Investment Goods | -0.8% | -0.6% | -1.9% | -12.6% | -8.3% | -3.8% | 5.8% |
| Mining | -2.9% | 1.1% | -5.9% | -27.2% | -15.9% | -5.1% | 3.5% |
| Electricity & Gas | -1.9% | 0.2% | 2.0% | 1.0% | 14.0% | 5.3% | -2.8% |

Robert Brusca
AuthorMore in Author Profile »Robert A. Brusca is Chief Economist of Fact and Opinion Economics, a consulting firm he founded in Manhattan. He has been an economist on Wall Street for over 25 years. He has visited central banking and large institutional clients in over 30 countries in his career as an economist. Mr. Brusca was a Divisional Research Chief at the Federal Reserve Bank of NY (Chief of the International Financial markets Division), a Fed Watcher at Irving Trust and Chief Economist at Nikko Securities International. He is widely quoted and appears in various media. Mr. Brusca holds an MA and Ph.D. in economics from Michigan State University and a BA in Economics from the University of Michigan. His research pursues his strong interests in non aligned policy economics as well as international economics. FAO Economics’ research targets investors to assist them in making better investment decisions in stocks, bonds and in a variety of international assets. The company does not manage money and has no conflicts in giving economic advice.
More Economy in Brief


