 Global| May 28 2004
Japan Employment and Consumer Spending Have Big Gains in April
Summary
Japan's economy gave more signs of building momentum in April. This has reached the consumer sector in a significant way. First, the labor force survey showed a sizable 240,000 increase in the number of people reporting they are [...]
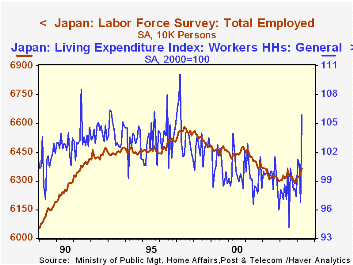
Japan's economy gave more signs of building momentum in April. This has reached the consumer sector in a significant way. First, the labor force survey showed a sizable 240,000 increase in the number of people reporting they are employed. This followed March's 190,000 rise and cumulates to 770,000 from an apparent trough last November. The total number of employed persons was 63.64 million, the highest since 63.66 million in January 2002. The peak in employment was 65.84 million in July 1997, just as the Asian currency crisis hit full force.
Consumer spending data look better too in April. The index of living expenditure per household jumped to 105.6 from March's 96.7 (2000=100). Press reports highlighted this leap as a record monthly increase. However, March's index had fallen 4.0%, so the two-month gain averages "just" 2.5%. Even so, this itself is the fifth largest such two-month change in the 29-year history of the survey.
A month ago, the Cabinet Office's consumer sentiment survey had reported a sizable rise in confidence in the first quarter, as people felt better about their job situation, income prospects and standard of living (see Louise Curley's comment here on April 27). They also indicated that this seemed to be a good time to buy durable goods. Today's report on their spending for April shows they did that, with a huge increase in furniture and household utensils for April that put the two-month advance at the highest in over five years. Transportation, education, culture and miscellaneous were also strong in April, while categories that might described as "necessities", food, clothing and housing, all declined. The more confident consumers are spending more vigorously on discretionary items than they have in quite some time.
| Apr 2004 | Mar 2004 | Feb 2004 | Year Ago | Annual Average||||
|---|---|---|---|---|---|---|---|
| 2003 | 2002 | 2001 | |||||
| Employment (millions) | 63.64 | 63.40 | 63.21 | 63.15 | 63.17 | 63.30 | 64.10 |
| Change (thousands or %) | +240 | +190 | -10 | +490 (+0.8%) | December/December | ||
| +0.3% | -1.1% | -1.2% | |||||
| Unemployment Rate (%) | 4.7% | 4.7% | 5.0% | 5.4% | Annual Average | ||
| 5.3% | 5.4% | 5.0% | |||||
| Household Spending (2000=100) | 105.9 | 96.7 | 100.7 | 98.6 | 98.0 | 99.3 | 99.4 |
| % Change | 9.5% | -4.0% | -0.5% | 7.5% | December/December | ||
| 0.9% | -3.1% | -4.8% | |||||
| · We've seen a collection of Q1 GDP reports the last two days. The highlight, we've judged, is the role of investment spending as a leading factor in better growth trends apparent in reports so far. Today we briefly summarize three more, Switzerland, Denmark and Hong Kong. The first two of these look somewhat different, with less buoyant investment sectors.· Switzerland is climbing gradually out of a period of stagnation, with its year-on-year GDP growth running at 1.5%, the best since Q2 2001. Consumer spending is the main support. Investment, though, is erratic at best and has been unable to sustain a strong 2003 performance into this year.· Denmark shows a similar current performance, although its behavior earlier differs from most economies. It seems not to have suffered much in the 2001 recession, and investment spending there was actually strong then. Thus, its investment cycle appears to have different timing from most, with a slowdown now after respectable gains in periods when capital spending elsewhere was weak. · Hong Kong did experience the 2001 recession in sync with others, but has come back with some vigor. Investment there is moving ahead in a recovery phase, while exports and inventory building provided the largest part of the 2.4% growth in Q1. |
|---|
| GDP & Select Components, % Changes | Qtr/Qtr (Seas Adj)Year/ Year | 4th Qtr/4th Qtr||||||
|---|---|---|---|---|---|---|---|
| 1st Qtr 2004 | 4th Qtr 2003 | 3rd Qtr 2003 | 2003 | 2002 | 2001 | ||
| Denmark (1995 Krone) | 0.6 | 0.6 | 0.3 | 1.3 | 1.0 | 0.4 | 0.9 |
| - Investment | -3.0 | 0.7 | 4.4 | 0.2 | 3.1 | 0.5 | 11.6 |
| Switzerland (2000 Swiss Francs) | 0.4 | 0.5 | 0.5 | 1.5 | 0.0 | 0.9 | 0.0 |
| - Fixed Capital Formation | -0.1 | 0.8 | 0.8 | 0.6 | 4.9 | -2.1 | -9.2 |
| Hong Kong (2000 HK$) | 2.4 | 2.5 | 4.9 | 6.8 | 4.9 | 4.8 | -1.1 |
| - Fixed Capital Formation | 1.3 | 2.3 | 4.0 | 5.8 | 1.9 | -0.3 | -4.4 |
Carol Stone, CBE
AuthorMore in Author Profile »Carol Stone, CBE came to Haver Analytics in 2003 following more than 35 years as a financial market economist at major Wall Street financial institutions, most especially Merrill Lynch and Nomura Securities. She had broad experience in analysis and forecasting of flow-of-funds accounts, the federal budget and Federal Reserve operations. At Nomura Securities, among other duties, she developed various indicator forecasting tools and edited a daily global publication produced in London and New York for readers in Tokyo. At Haver Analytics, Carol was a member of the Research Department, aiding database managers with research and documentation efforts, as well as posting commentary on select economic reports. In addition, she conducted Ways-of-the-World, a blog on economic issues for an Episcopal-Church-affiliated website, The Geranium Farm. During her career, Carol served as an officer of the Money Marketeers and the Downtown Economists Club. She had a PhD from NYU's Stern School of Business. She lived in Brooklyn, New York, and had a weekend home on Long Island.
More Economy in Brief


