 Global| Sep 10 2007
Italy’s GDP Snakes Below 2% Year-over-year
Summary
GDP slows, private consumption holds up, capital formation slows. GDP is slowing in Italys quarterly and annual framework. Private consumption has been holding up and even improving slightly, but remains at a subdued pace around the [...]
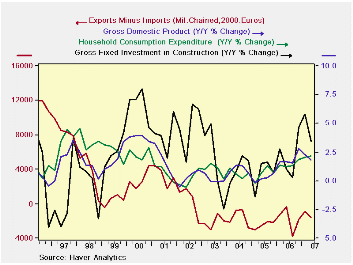
GDP slows, private consumption holds up, capital formation slows.
GDP is slowing in Italy’s quarterly and annual framework. Private consumption has been holding up and even improving slightly, but remains at a subdued pace around the two percent mark. Capital formation has slowed. The trade gap is subtracting from GDP in the recent quarter as exports fell by more than imports. In July Germany reported a sharp weakening in its industrial orders from overseas. This export weakness reported by Italy may be part of that same signal. Domestic demand in Italy is up in the quarter but only holding steady Yr/Yr at a 2.2% pace, a bit of reduced pace from late last year.
| Consumption | Capital Formation | ||||||||||
| GDP | Private | Public | Total | Construction | Machinery | X-M:Bil.Euro | Exports | Imports | Domestic Demand |
||
| % change Q/Q; X-M is Q/Q change in Blns of euros | |||||||||||
| Q2-07 | 0.5% | 2.4% | 0.6% | 0.4% | -5.0% | -1.1% | -0.6 | -4.0% | -1.1% | 1.3% | |
| Q1-07 | 1.1% | 2.9% | 0.4% | 1.6% | 6.3% | -0.1% | 0.9 | -0.3% | -4.3% | 0.0% | |
| Q4-06 | 4.6% | 0.8% | 0.0% | 8.5% | 11.9% | 7.1% | 1.9 | 18.0% | 7.2% | 2.1% | |
| Q3-06 | 1.2% | 2.5% | 0.8% | -2.2% | 1.4% | -0.6% | -3.4 | -7.3% | 9.0% | 5.5% | |
| % change Yr/Yr; X-M is Yr/Yr change in Gap in Bil of euros | |||||||||||
| Q2-07 | 1.8% | 2.2% | 0.4% | 2.0% | 3.4% | 1.3% | -1.2 | 1.1% | 2.6% | 2.2% | |
| Q1-07 | 2.3% | 2.0% | 0.2% | 2.5% | 5.8% | 1.3% | 0.4 | 3.6% | 3.1% | 2.2% | |
| Q4-06 | 2.8% | 1.9% | -0.3% | 3.9% | 4.6% | 3.6% | 0.3 | 6.0% | 5.5% | 2.7% | |
| Q3-06 | 1.6% | 1.3% | -0.4% | -0.1% | 0.3% | -0.3% | -1.6 | 3.1% | 5.1% | 2.1% | |
| 5-Yrs | 1.0% | 1.2% | 1.0% | 1.4% | 2.3% | 1.0% | na | 1.3% | 2.1% | 1.2% | |
by Robert Brusca September 10, 2007
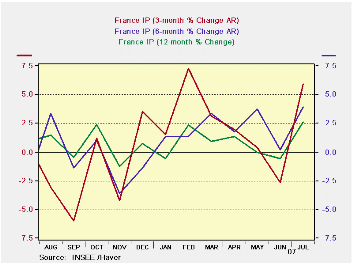
French industrial output is up strongly on the heels of weak numbers from Germany and the UK and with ongoing weakness in Italy. In France, industrial production jumped by 1.3% in July, boosted by autos, a sector that had been weak. Consumer spending is still touch-and-go as the output of consumer goods that services that demand fell in July and rose by just 0.1% in June. Capital goods output and intermediate output remain firm and have strengthened in recent months. The consumer remains as a big question-mark in EMU. The unrest in financial markets raises further questions about the consumer and confidence. France stands in stark contrast to industrial production trends elsewhere in the Euro area.
| SAAR except m/m | Jul-07 | Jun-07 | May-07 | 3-month | 6-month | 12-month |
| IP total | 1.3% | -0.6% | 0.8% | 5.9% | 3.9% | 2.6% |
| Consumer | -0.1% | 0.1% | 0.9% | 3.5% | 1.6% | 1.4% |
| Capital | 1.0% | 0.6% | 0.5% | 8.8% | 6.0% | 3.5% |
| Intermediate | 1.7% | -1.0% | 0.7% | 5.8% | 5.2% | 3.6% |
| Memo | ||||||
| Auto | 4.7% | -2.4% | -2.5% | -1.5% | 4.2% | 2.3% |
by Louise Curley September 10, 2007
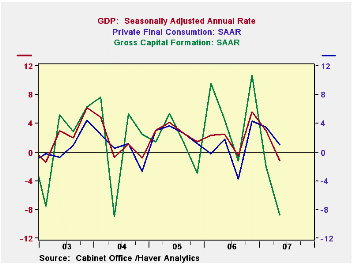
Revised data for Japan's second quarter GDP revealed a 1.2% seasonally adjusted rate of decline, in contrast to a 0.5% increase estimated earlier and a consensus of a 0.7% decline. The main culprit in the decline was a sharp drop in gross capital formation, which declined at a seasonally adjusted annual rate of almost 7%. Inventories also declined. While final private consumption increased, the annual rate of increase was smaller than in the first quarter. The first chart shows the annual rates of change for total GDP, private consumption and gross fixed capital formation.
Although small, the second quarter increase in the net exports of good and services resulted in a record 24.1 trillion 2000 chained yen as shown in the second chart.
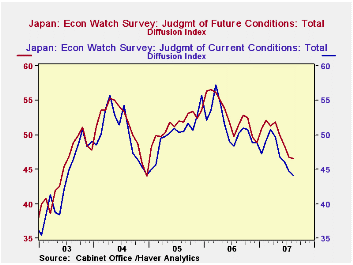
The decline in Japan's second quarter GDP preceded the financial turmoil which has roiled world stock markets and cast doubts on world economic growth. The Japanese are now reappraising their outlook for the rest of the year. The August Economy Watchers Survey released today is not encouraging. The diffusion indexes regarding current and future conditions continue to decline, as shown in the third chart.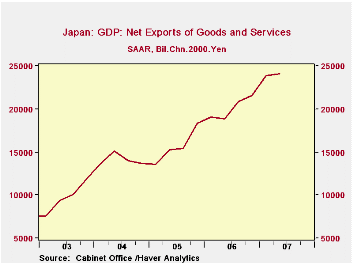
| JAPAN: Gross Domestic Product (Trillion 2000 Chained Yen) |
Q2 2007 | Q1 2007 | Q2 2006 | Q/Q SAAR | Y/Y Chg | 2006 | 2005 | 2004 |
|---|---|---|---|---|---|---|---|---|
| Total | 557.4 | 539.1 | 548.2 | -1.21 | 1.67 | 549.0 | 537.2 | 527.3 |
| Private Consumption | 308.9 | 308.2 | 305.2 | 1.01 | 1.22 | 304.3 | 301.7 | 297.1 |
| Gross Fixed Capital Formation | 127.3 | 129.6 | 127.7 | -6.97 | -0.34 | 127.6 | 123.3 | 120.5 |
| Change in Inventories | 1.0 | 1.6 | 1.3 | -2.6* | -0.3* | 1.6 | 1.4 | 2.0 |
| Exports of Goods and Services | 85.6 | 85.0 | 79.7 | 3.07 | 7.38 | 80.6 | 73.5 | 68.8 |
| Imports of Goods & Services | 61.5 | 61.1 | 60.8 | 2.43 | 1.02 | 60.5 | 57.9 | 54.7 |
| ECONOMY WATCHERS SURVEY | Aug 07 | Jul 07 | Aug 06 | Q/Q Chg | Y/Y Chg | 2006 | 2005 | 2004 |
| Current Conditions (%) | 44.1 | 44.7 | 46.8 | -0.6* | -2.7* | 51.4 | 50.3 | 50.0 |
| Future Conditions (%) | 46.5 | 46.7 | 50.0 | -0.2* | -3.5* | 52.9 | 51.5 | 51.4 |
| * Differences | ||||||||
by Tom Moeller September 10, 2007
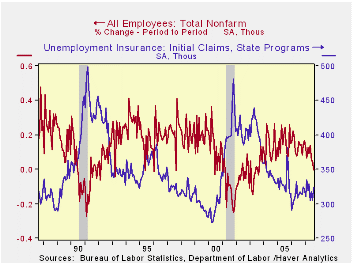
The decline in U.S. payrolls during August has raised the question of whether a recession in the overall economy is to come. In the past, sustained employment declines have been coincident with recession's onset, and sometimes they have lagged it. The question will become more relevant after the figures for September are released next month.
It is then that a bounce back in state employment will probably lift the numbers. State employment has declined a collective 74,000 during the last two months. This months' numbers will reflect the return of teenagers who left early for school.
As for the modest rise in private service sector jobs of 88,000, that's more problematic. Payrolls were unchanged in the financial industries following previously firm gains. Payrolls fell 4,200 in the transportation industries after modest growth earlier in the year. The 7,000 worker decline in information services looks real as it followed two months of decline in this industry where hiring is genuinely under pressure.
The 22,000 drop in construction employment is hardly problematic. Recent declines in that industry are likely to continue. The real question is whether they will spread.
What is true is that past declines in employment of one month, coupled with all these questions about its validity, have nearly always been followed by recovery; and often a sharp one. What is always true, however, is that employment declines are never sustained unless initial claims for unemployment insurance, a true leading indicator, rise. And so far that has not happened.
So we're left waiting.

Robert Brusca
AuthorMore in Author Profile »Robert A. Brusca is Chief Economist of Fact and Opinion Economics, a consulting firm he founded in Manhattan. He has been an economist on Wall Street for over 25 years. He has visited central banking and large institutional clients in over 30 countries in his career as an economist. Mr. Brusca was a Divisional Research Chief at the Federal Reserve Bank of NY (Chief of the International Financial markets Division), a Fed Watcher at Irving Trust and Chief Economist at Nikko Securities International. He is widely quoted and appears in various media. Mr. Brusca holds an MA and Ph.D. in economics from Michigan State University and a BA in Economics from the University of Michigan. His research pursues his strong interests in non aligned policy economics as well as international economics. FAO Economics’ research targets investors to assist them in making better investment decisions in stocks, bonds and in a variety of international assets. The company does not manage money and has no conflicts in giving economic advice.
More Economy in Brief


