 Global| Dec 29 2009
Italian Business Confidence Advances...But Still Lags
Summary
Italian business confidence is shooting up strongly but still clings to relatively weak absolute readings. The level of the current reading stands in the 52nd percentile of the range of values occupied since October of 1996. But by [...]
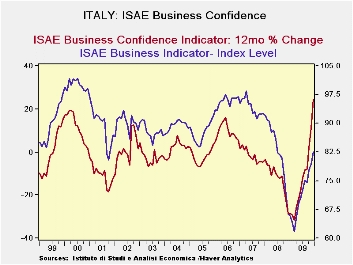
Italian business confidence is shooting up strongly but still clings to relatively weak absolute readings. The level of the current reading stands in the 52nd percentile of the range of values occupied since October of 1996. But by rank the current index stands 136th out of 159 readings or in the bottom 12 percentile of all readings over that same span. That is not a very reassuring statistic despite the rise in the index this month. This percentile rank-in-queue measure is uniformly weak across the various components this month. Unfortunately inventories have the highest reading within each commodity category. Of all commodity types consumer goods are doing the best while investment goods and intermediates goods are lagging nearly equally.
The graphic below shows the strength of the current surge depicting both the absolute level of the index and its percentage rise on the same graph. We can hope that the rise continues and that it will bolster the level reading further. But for the rest of the e-Zone a good deal of pessimism remains.
France’s final GDP figure confirms the weak rise in GDP in Q3 although it does show two quarterly gains in a row. In the UK private forecasters have reaffirmed their view of slow growth in the UK for the year to come. Italy’s business survey results seem to fit snugly into this grouping of reports that shows some improvement but still no gusto.
Italy ISAE Business Sentiment| Since Oct 1996 | |||||||
| Dec-09 | Nov-09 | Oct-09 | Sep-09 | Percentile | Rank | Rank% | |
| Biz Confidence | 82.6 | 79.4 | 77.8 | 74.6 | 52.0 | 139 | 12.7% |
| TOTAL INDUSTRY | |||||||
| Order books & Demand | |||||||
| Total | -40 | -47 | -50 | -52 | 33.8 | 146 | 8.2% |
| Domestic | -41 | -47 | -49 | -49 | 35.8 | 146 | 8.2% |
| Foreign | -41 | -49 | -54 | -55 | 35.8 | 146 | 8.2% |
| Inventories | -2 | -2 | -3 | 1 | 37.5 | 125 | 21.5% |
| Production | -38 | -45 | -49 | -47 | 28.6 | 147 | 7.6% |
| INTERMEDIATE | |||||||
| Order books & Demand | |||||||
| Total | -52 | -55 | -57 | -55 | 26.8 | 146 | 8.2% |
| Domestic | -53 | -55 | -57 | -54 | 27.4 | 146 | 8.2% |
| Foreign | -49 | -56 | -56 | -59 | 31.6 | 146 | 8.2% |
| Inventories | -4 | -6 | -7 | -1 | 37.9 | 113 | 29.1% |
| Production | -48 | -51 | -52 | -51 | 25.0 | 147 | 7.6% |
| INVESTMENT GOODS | |||||||
| Order books & Demand | |||||||
| Total | -45 | -56 | -62 | -61 | 26.7 | 146 | 8.2% |
| Domestic | -45 | -54 | -54 | -55 | 30.0 | 146 | 8.2% |
| Foreign | -48 | -54 | -66 | -61 | 25.3 | 147 | 7.6% |
| Inventories | -3 | 0 | -1 | -1 | 36.8 | 111 | 30.4% |
| Production | -45 | -52 | -61 | -58 | 21.6 | 147 | 7.6% |
| CONSUMER GOODS | |||||||
| Order books & Demand | |||||||
| Total | -23 | -32 | -36 | -38 | 44.9 | 133 | 16.5% |
| Domestic | -23 | -32 | -36 | -39 | 50.0 | 125 | 21.5% |
| Foreign | -31 | -36 | -41 | -42 | 37.1 | 141 | 11.4% |
| Inventories | -2 | 1 | -1 | 1 | 34.6 | 111 | 30.4% |
| Production | -21 | -33 | -37 | -33 | 43.9 | 137 | 13.9% |
| Total number of months: 159 | |||||||
by Louise Curley December 29, 2009
 Reports of
retail trade in Spain, Sweden and Hong Kong were among today's
statistical releases. Retail sales are sometimes good
indicators of trends in total GDP. In order to test this
hypothesis, we computed the correlation coefficients between the year
over year percent change in the quarterly values of the value index of
retail sales and the year over year percent change in the value of
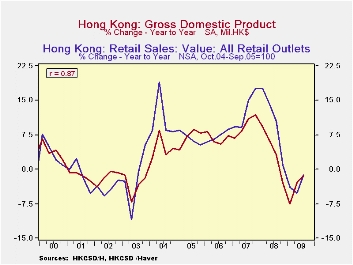
total GDP over the past ten years*. The first three charts
show these correlations.
The highest correlation was in Spain where
the correlation coefficient was .94. Hong Kong was next at
.87 and Sweden was the lowest at .64. The correlation
coefficient squared, R2, is a measure of the
explanatory power of one variable on the other when all other factors
are held constant. 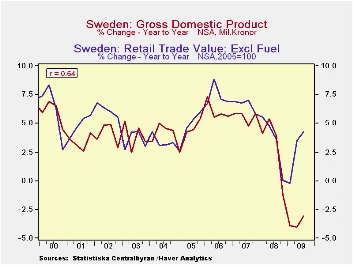 Thus, in the case of Spain, based on the
experience of the last ten years, the year to year change in retail
sales explains about 88.4% of the variation in total GDP when all other
factors are held constant. In the case of Hong Kong, the year
to year change retail sales explains 75.7% of the change in total GDP
and in the case of Sweden, only 41%. The precise values are less
important than the order of magnitude. Thus, we should expect
the trend in retail sales in Spain to have a greater impact on the
trend in total GDP than that in Hong Kong or Sweden.
The fourth chart
shows the year over year changes in monthly retail sales in the three
countries.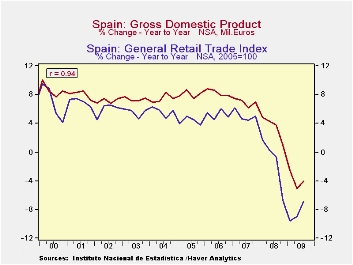 On the basis of the past relationship between
retail sales and total GDP the year to year changes in the value of
retail sales in October and November of 9.9% and 11.7% for Hong Kong
suggest there is a good chance that the year to year change in the
fourth quarter total GDP will increase from -1.99% in the third quarter
to perhaps a positive value. The continued negative, though
diminishing, yearly comparisons of retail sales in Spain suggest that
any improvements in year to year comparison for total GDP in the fourth
quarter is likely to be small.
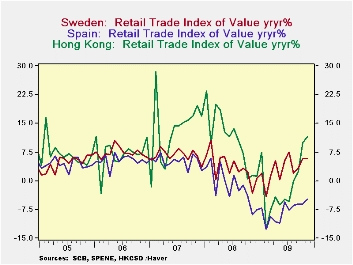 For Sweden, the year to year
increases in retail sales of 5.8% and 5.7% in October and November may
be large enough to have a positive effect on the increase in total GDP
in spite of the fact that the yearly change in retail sales has less
than a major effect on the change in total GDP. *(Computation of the
correlation coefficient can be done in DLXVG3 by clicking on
"Correlation" in the TOOLS menu.)
| Retail Sales, Value Indexes Y/Y % Change | Nov 09 | Oct 09 | Sep 09 | Aug 09 | Jul 09 | Jun 09 | May 09 | Apr 09 | Mar 09 |
|---|---|---|---|---|---|---|---|---|---|
| Sweden | 5.74 | 5.80 | 3.38 | 1.80 | 7.51 | 5.16 | 0.32 | 5.21 | 1.26 |
| Spain | -4.99 | -6.03 | -6.08 | -6.51 | -7.75 | -5.54 | -10.91 | -10.57 | -9.30 |
| Hong Kong | 11.66 | 9.87 | 2.57 | -0.07 | -5.29 | -4.71 | -6.20 | -4.30 | -7.76 |
Robert Brusca
AuthorMore in Author Profile »Robert A. Brusca is Chief Economist of Fact and Opinion Economics, a consulting firm he founded in Manhattan. He has been an economist on Wall Street for over 25 years. He has visited central banking and large institutional clients in over 30 countries in his career as an economist. Mr. Brusca was a Divisional Research Chief at the Federal Reserve Bank of NY (Chief of the International Financial markets Division), a Fed Watcher at Irving Trust and Chief Economist at Nikko Securities International. He is widely quoted and appears in various media. Mr. Brusca holds an MA and Ph.D. in economics from Michigan State University and a BA in Economics from the University of Michigan. His research pursues his strong interests in non aligned policy economics as well as international economics. FAO Economics’ research targets investors to assist them in making better investment decisions in stocks, bonds and in a variety of international assets. The company does not manage money and has no conflicts in giving economic advice.


