 Global| Oct 05 2005
ISM Non-Manufacturing Index Back Down
by:Tom Moeller
|in:Economy in Brief
Summary
The Business Activity Index for the non-manufacturing sector from the Institute for Supply Management fell a sharp 11.7 points to 53.3 in September. It was a record m/m drop and was at least partly due to Hurricane Katrina. Consensus [...]
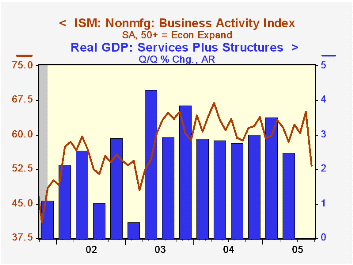
The Business Activity Index for the non-manufacturing sector from the Institute for Supply Management fell a sharp 11.7 points to 53.3 in September. It was a record m/m drop and was at least partly due to Hurricane Katrina. Consensus expectations had been for a lesser decline to 59.7.
Since the series' inception in 1997 there has been a 50% correlation between the Business Activity Index and the q/q change in real GDP for services plus construction.
The orders index reversed more than all of the gains during the prior two months with a 9.2 point decline. The employment index similarly fell to the lowest level since May. Since the series' inception in 1997 there has been a 60% correlation between the level of the ISM non-manufacturing employment index and the m/m change in payroll employment in the service producing plus the construction industries.
Pricing power surged 14.3 points to a record high.
ISM surveys more than 370 purchasing managers in more than 62 industries including construction, law firms, hospitals, government and retailers. The non-manufacturing survey dates only to July 1997, therefore its seasonal adjustment should be viewed tentatively.Business Activity Index for the non-manufacturing sector reflects a question separate from the subgroups mentioned above. In contrast, the NAPM manufacturing sector composite index is a weighted average five components.
| ISM Nonmanufacturing Survey | Sept | Aug | Sept '04 | 2004 | 2003 | 2002 |
|---|---|---|---|---|---|---|
| Business Activity Index | 53.3 | 65.0 | 58.7 | 62.4 | 58.2 | 55.1 |
| Prices Index | 81.4 | 67.1 | 70.1 | 69.0 | 56.8 | 54.0 |
by Tom Moeller October 5, 2005
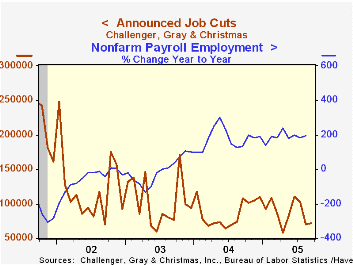
Challenger, Grey & Christmas reported that job cut announcements rose a slight 1.8% in September to 71,836 following a 31.5% m/m drop during August. The three month average of job cut announcements fell 13.8% to 81,793 (-2.5% y/y).
During the last ten years there has been an 84% (inverse) correlation between the three month moving average of announced job cuts and the three month change payroll employment.
Moderate increases in job cut announcements were scattered throughout industry but large m/m increases in retail (688.4% y/y), consumer goods (-21.3% y/y) and electronics (72.8% y/y) were offset by declines in insurance (20.4% y/y), telecommunications (-91.3% y/y) and pharmaceuticals (67.5% y/y).
Job cut announcements differ from layoffs. Many are achieved through attrition, early retirement or just never occur.
Challenger also reported that announced hiring plans fell sharply m/m (-3.1% y/y).
| Challenger, Gray & Christmas | Sept | Aug | Y/Y | 2004 | 2003 | 2002 |
|---|---|---|---|---|---|---|
| Announced Job Cuts | 71,836 | 70,571 | -33.4% | 1,039,175 | 1,236,426 | 1,431,052 |
by Tom Moeller October 5, 2005
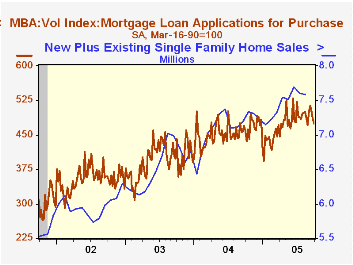
The total number of mortgage applications fell 1.1% last week following the sharp 6.6% drop the prior week, according to the Mortgage Bankers Association. In September, applications did rise 0.2% from August but the average level was down 6.7% from a recent peak in June.
Purchase applications fell for the third consecutive week. A 1.9% decline reduced the gain in September to 1.0% versus August. During the last ten years there has been a 49% correlation between the y/y change in purchase applications and the change in new plus existing single family home sales.
Mortgage applications to refinance were roughly unchanged w/w after the 10.5% plunge the prior week. For September, refis fell 0.7% m/m following a 10.6% drop in August.
The effective interest rate on a conventional 30-year mortgage rose to 6.18% from 6.09% the week prior and the effective rate on a 15-year mortgage rose to 5.83%. The interest rate on 15 and 30 year mortgages are closely correlated (>90%) with the rate on 10 year Treasury securities.
The Mortgage Bankers Association surveys between 20 to 35 of the top lenders in the U.S. housing industry to derive its refinance, purchase and market indexes. The weekly survey accounts for more than 40% of all applications processed each week by mortgage lenders. Visit the Mortgage Bankers Association site here.
House Prices and Monetary Policy: A Cross-Country Study from the Board of Governors of the Federal Reserve System is available here.
Yesterday's speeches from several Federal Reserve Board officials contained comments on the economic outlook, the business cycle and Fed Policy. Dallas Fed President Fisher's comments can be found here, St. Louis Fed President Poole's speech is here and Philadelphia Fed President Santomero's comments are available here.
| MBA Mortgage Applications (3/16/90=100) | 09/30/05 | 09/23/05 | Y/Y | 2004 | 2003 | 2002 |
|---|---|---|---|---|---|---|
| Total Market Index | 713.5 | 721.2 | -1.6% | 735.1 | 1,067.9 | 799.7 |
| Purchase | 473.8 | 483.1 | 3.2% | 454.5 | 395.1 | 354.7 |
| Refinancing | 2,107.4 | 2,106.6 | -7.2% | 2,366.8 | 4,981.8 | 3,388.0 |
by Carol Stone October 5, 2005
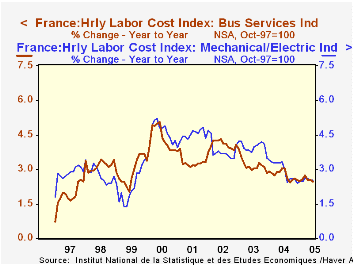
Labor costs in France have maintained a steady trend over the last several months, rising at about a 2-1/2% pace, year-on-year.These hourly data are reported for selected sectors of French industry, with mechanical/electrical manufacturers running just above 2.5% and business services just below that rate. Labor costs in the textile industry have seen a pickup this year to 3.2% in June from 2.3% in December 2004, while clothing and leather have risen slightly faster this year at 2.15% compared with 1.77%.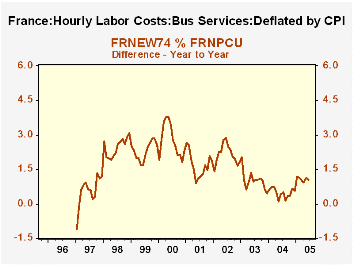
For workers, the flatter trends in machinery and services since last autumn would be a welcome development after several years of progressively slower gains. In addition, as noted in the table below, consumer prices through June had also slowed noticeably. In this comparison, we chose the CPI for urban workers, which may reflect more closely than the overall CPI the group covered by the labor cost data. The combination of the labor cost and CPI figures shows that through the first half of this year, the real purchasing power of hourly compensation picked up to about 1% for both mechanical equipment and service workers from only about 0.5% across last year. This is evident in the second graph.
Since June the CPI has begun rising more rapidly, with a 1.7% year-on-year increase in August. So the improvement in workers' purchasing power may have ended. But at least any slowing would be from a faster rate than had prevailed last year, and in the service sector, 2003 as well.
| France: Hourly Labor Costs (NSA, yr/yr % chg) | June 2005 | May 2005 | December/December|||
|---|---|---|---|---|---|
| 2004 | 2003 | 2002 | |||
| Mechanical/Electrical Industries | 2.53 | 2.53 | 2.41 | 3.49 | 4.07 |
| Business Services Industries | 2.47 | 2.56 | 2.52 | 2.84 | 4.08 |
| CPI: Urban Workers | 1.53 | 1.53 | 2.01 | 2.43 | 2.39 |

Tom Moeller
AuthorMore in Author Profile »Prior to joining Haver Analytics in 2000, Mr. Moeller worked as the Economist at Chancellor Capital Management from 1985 to 1999. There, he developed comprehensive economic forecasts and interpreted economic data for equity and fixed income portfolio managers. Also at Chancellor, Mr. Moeller worked as an equity analyst and was responsible for researching and rating companies in the economically sensitive automobile and housing industries for investment in Chancellor’s equity portfolio. Prior to joining Chancellor, Mr. Moeller was an Economist at Citibank from 1979 to 1984. He also analyzed pricing behavior in the metals industry for the Council on Wage and Price Stability in Washington, D.C. In 1999, Mr. Moeller received the award for most accurate forecast from the Forecasters' Club of New York. From 1990 to 1992 he was President of the New York Association for Business Economists. Mr. Moeller earned an M.B.A. in Finance from Fordham University, where he graduated in 1987. He holds a Bachelor of Arts in Economics from George Washington University.
More Economy in Brief


