 Global| Dec 01 2008
ISM Index the Lowest Since 1982 Recession; Pricing Power Evaporated
by:Tom Moeller
|in:Economy in Brief
Summary
The Institute for Supply Management (ISM) reported that its November Composite Index of Activity in the manufacturing sector came in at 36.2. The index fell 2.7 points from October and it was the fifth decline in as many months. The [...]
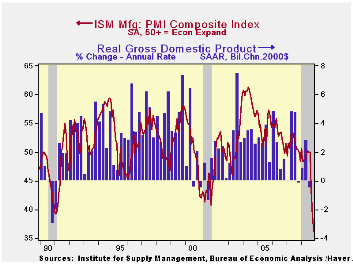
The Institute for Supply Management (ISM) reported that its November Composite Index of Activity in the manufacturing sector came in at 36.2. The index fell 2.7 points from October and it was the fifth decline in as many months. The figure was again the lowest level since the 1981-82 recession and was lower than expectations for a reading of 37.5. The break-even level for this diffusion index of factory sector activity is 50.
During the last twenty years there has been a 64% correlation between the level of the Composite Index and the three-month growth in factory sector industrial production.
It is appropriate to correlate the ISM index level with factory sector growth because the ISM index is a diffusion index. It measures growth by using all of the positive changes in activity added to one half of the zero change in activity measures.
Lower oil prices plunged the separate index of prices paid by another 11.5 points. It fell to 25.5 after the 16.5 point October drop. The latest was the lowest level since 1949. During the last twenty years there has been a 79% correlation between the price index and the three-month change in the PPI for intermediate goods.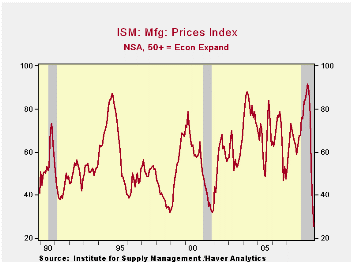
During the last three months the ISM index composite index fell by nearly fourteen points. A decline of that magnitude was exceeded only by the drop during the short "credit crunch" recession of 1980. Following that decline, the index bounced back smartly only then to fall again during the sharp recession of 1981-82. How severe was that economic downturn? During all of 1982 the average level of the ISM (then called the Nat'l Association of Purchasing Management) index was 38.5 versus an average 52.5 during 1979. The index level signaled a 5.4% decline in factory sector industrial production during 1982 as reported by the Federal Reserve Board.
The new orders index during November again fell sharply to 27.9. The index is down over twenty points during the last three months, again the sharpest decline since 1980. Only 12% of survey participants reported higher orders while 59% reported lower orders. The export order index continued to reflect economic weakness outside of the U.S., though it was unchanged at 41.0, the lowest level in this index's short twenty year history. During the last ten years there has been a 53% correlation between the index and the q/q change in real exports of goods in the GDP accounts.
The production sub-series reflected the weakness in new orders and it fell 2.6 points to 31.5, off 20.6 points during the last three months. Following was the employment index which logged a slight m/m decline to 34.2, the lowest reading since early 1991. During the last twenty years there has been a 67% correlation between the level of the ISM employment index and the three-month growth in factory sector employment.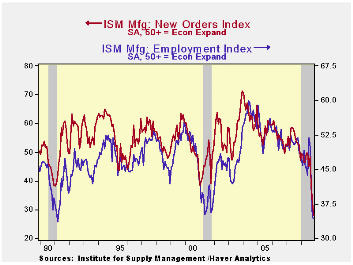
The shedding of inventories continues. The index level of 39.1 was down from 44.3 in October and was at its lowest since the recession of 2001. The index gauging the speed of supplier deliveries fell further (indicating faster delivery) and order backlogs fell to the lowest level in the series' history.
Too big to fail: the way forward from the Federal Reserve Bank of Minneapolis can be found here.
| ISM Mfg | November | October | November '07 | 2007 | 2006 | 2005 |
|---|---|---|---|---|---|---|
| Composite Index | 36.2 | 38.9 | 50.0 | 51.1 | 53.1 | 54.4 |
| New Orders Index | 27.9 | 32.2 | 52.5 | 54.3 | 55.4 | 57.4 |
| Employment Index | 34.2 | 34.6 | 48.4 | 50.5 | 51.7 | 53.6 |
| Prices Paid Index (NSA) | 25.5 | 37.0 | 67.5 | 64.6 | 65.0 | 66.4 |

Tom Moeller
AuthorMore in Author Profile »Prior to joining Haver Analytics in 2000, Mr. Moeller worked as the Economist at Chancellor Capital Management from 1985 to 1999. There, he developed comprehensive economic forecasts and interpreted economic data for equity and fixed income portfolio managers. Also at Chancellor, Mr. Moeller worked as an equity analyst and was responsible for researching and rating companies in the economically sensitive automobile and housing industries for investment in Chancellor’s equity portfolio. Prior to joining Chancellor, Mr. Moeller was an Economist at Citibank from 1979 to 1984. He also analyzed pricing behavior in the metals industry for the Council on Wage and Price Stability in Washington, D.C. In 1999, Mr. Moeller received the award for most accurate forecast from the Forecasters' Club of New York. From 1990 to 1992 he was President of the New York Association for Business Economists. Mr. Moeller earned an M.B.A. in Finance from Fordham University, where he graduated in 1987. He holds a Bachelor of Arts in Economics from George Washington University.
More Economy in Brief


